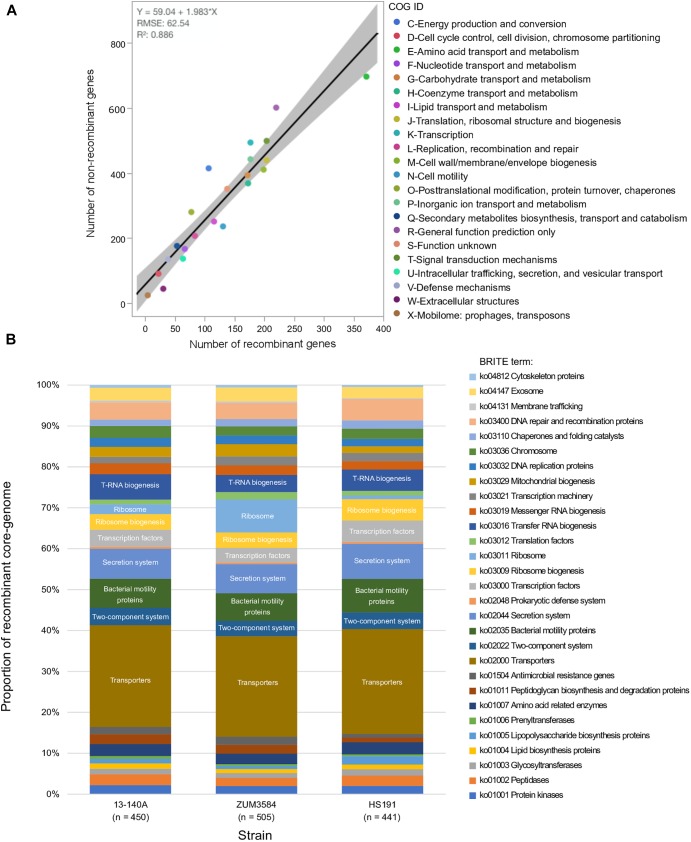
FIGURE 3.
Functional impact of recombination on phylogroup 2b-a. Comparison of COG category compositions corresponding to the recombination-free and recombinant core genome of phylogroup 2b-a. (A). Stacked bar-chart showing the proportion of KEGG BRITE functional categories assigned to the recombinant core genome of three strains representative of phylogroup 2b-a recombination profiles (B).

