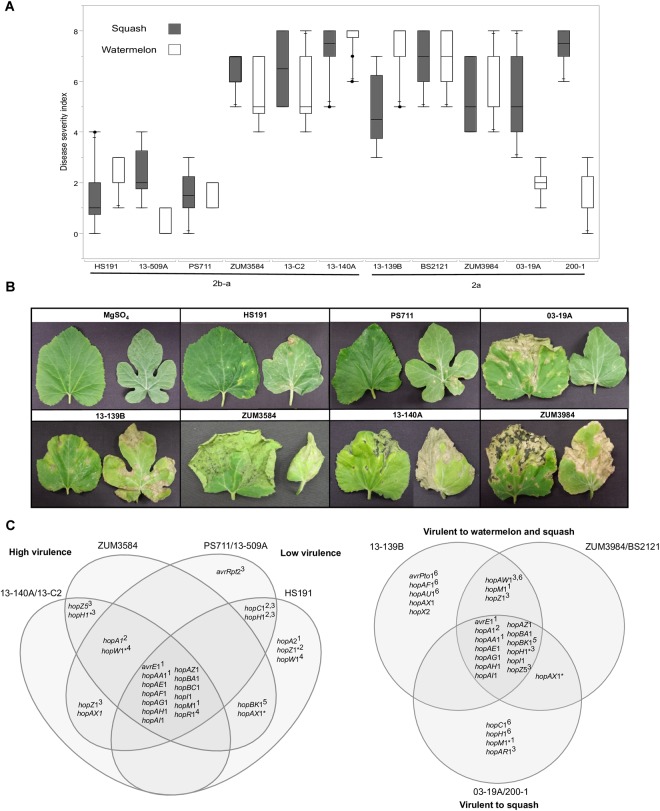
FIGURE 7.
Correlation between T3SE profiles and pathogenicity of P. syringae strains to watermelon and squash. Pathogenicity analysis for representative cucurbit strains and the millet strain, HS191, from phylogroups 2a and 2b-a. Mean severity rating from 0 to 8, taken 14 days after inoculation from two independent growth room experiments (n = 10) (A). Representative bacterial spot symptoms on squash and watermelon, respectively (B). Comparison of effector repertoires among strains used in pathogenicity testing for phylogroups 2b-a (left) and 2a (right). An asterisk indicates a predicted disruption in the coding sequence and the superscript indicates the genomic regions of the effector gene in the genome assemblies: 1conserved effector locus, 2exchangeable effector locus, 3integrative and conjugative element locus, 4other genomic island, 5phage region, 6plasmid. An effector gene with multiple superscripts indicates a T3SE was acquired through different sources among strains (C).

