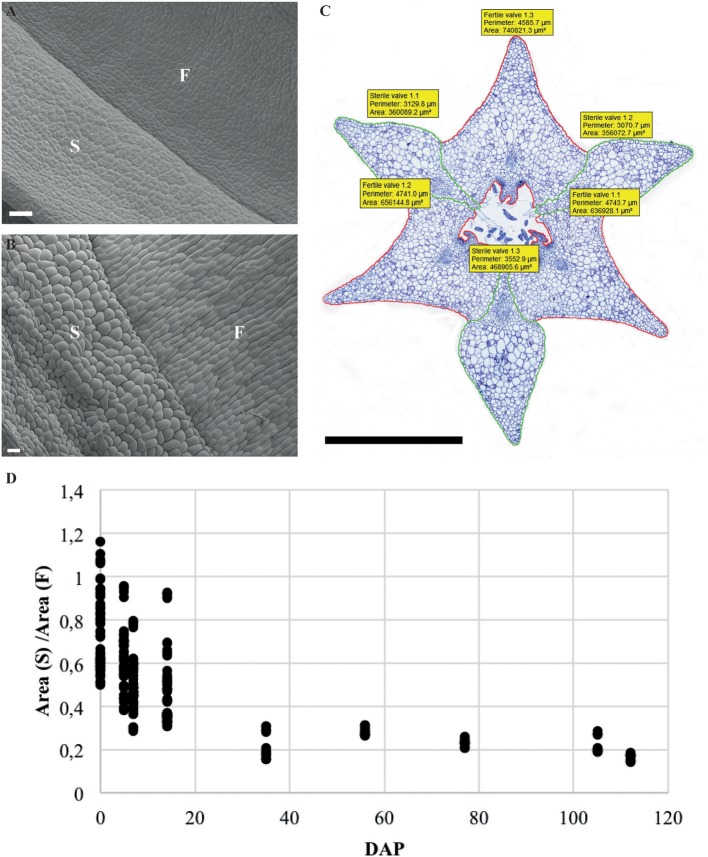
Figure 4.
Ratio and normalized area of the fertile and sterile valve of E. pusilla fruits during development from 0 to 112 DAP. (A) SEM image of external surface of 1 WAP. (B) SEM image of external surface of 16 WAP. (C) Perimeter and area measurement of a fruit cross-section at 5 WAP. (D) Spread of the ratio area (S)/area (F). Each dot represents one individual fruit. F, fertile valve; S, sterile valve. DAP, days after pollination; Color codes: green, sterile valve; red, fertile valve. Scale bar (A,B) = 100 μm, (C) = 1 mm.

