Fig. 4.
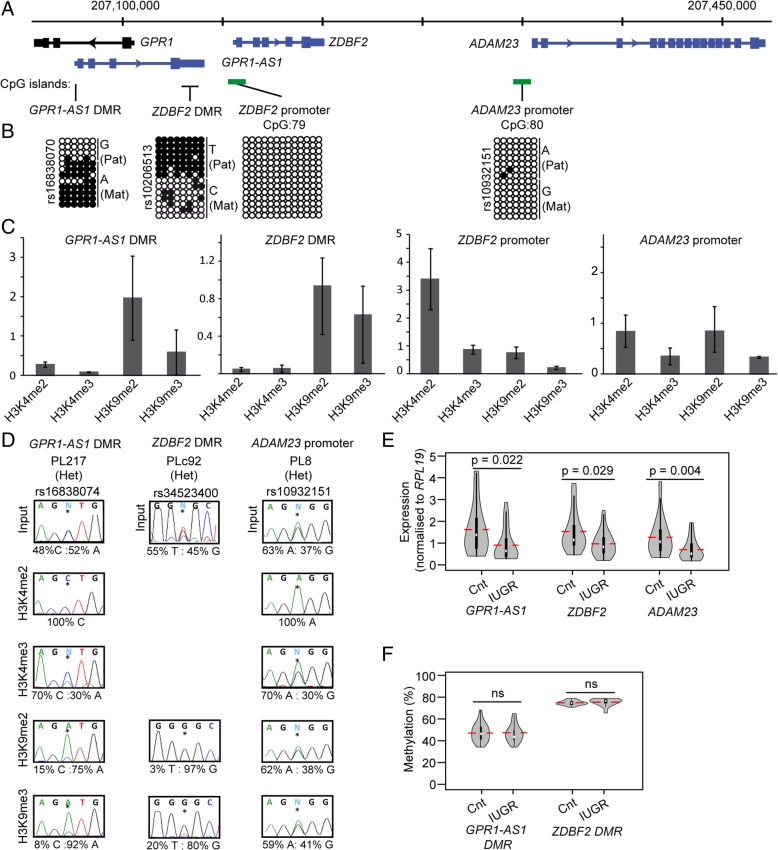
Epigenetic and transcriptional description of the GPR1-AS1-ADAM23 locus in IUGR placentas. a Schematic representation of the GPR1-AS1-ADAM23 imprinted locus on chromosome 2, indicating the position of the transcripts and CpG islands incorporating the DMRs. b Characterization of the DMRs and promoter CpG islands in placenta biopsies. Each circle represents a single CpG on a DNA strand. (•) methylated cytosine, (o) unmethylated cytosine. Each row corresponds to an individual cloned sequence with the genotype indicated for heterozygous SNP incorporated into the amplicon. c Quantitative PCR on ChIP material. Precipitations were normalized to GAPDH promoter (H3K4me2/3) and SAT2 repeats (H3K9me2/3). The graphs represent the mean values (± standard deviation). For each placenta sample, values are the mean of at least three independent ChIP experiments, each in triplicate. d The allelic distribution of each mark was determined by direct sequencing of the PCR product encompassing heterozygous SNPs. e Quantification of expression levels of GPR1-AS1, ZDBF2, and ADAM23 using microfluidic-based RT-qPCR. The results are presented as violin plots, with the median (white dot), mean (red line), and the interquartile range (black rectangle) shown. All expression levels were normalised to the mean of the RPL19 housekeeping gene. To determine the statistical significance of the difference between the IUGR and control groups, Student’s two-tailed t test was used and p values are indicated over the horizontal comparison lines. f Pyrosequencing quantification of the GPR1-AS1 and ZDBF2 DMRs. The violin plots include the median (white dot) mean (red line) and the interquartile range (black rectangle). The non-parametric Mann-Whitney-Wilcoxon test was used to calculate the statistical significance of the differences between IUGR and control groups (ns indicated no significance, p > 0.05)

