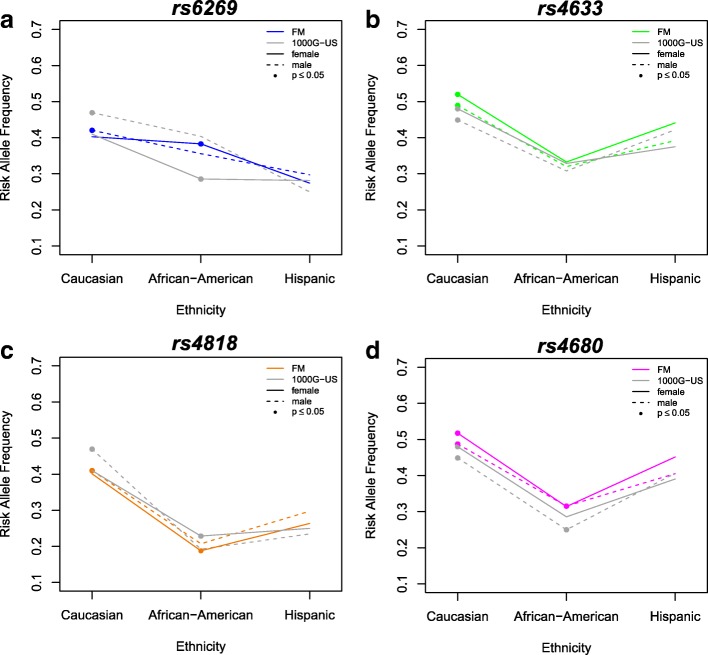
Fig. 2.
Comparing individuals with a diagnosis of fibromyalgia (FM) to US populations from the 1000 Genomes Project (1000G-US), the minor allele frequencies (MAFs) of each COMT SNP vary by sex and ethnicity. MAF of each COMT SNP are represented by colored lines in the FM group and by gray lines in the US populations from the 1000 Genomes Project. Solid lines denote females and dashed lines denote males. Significant differences (p ≤ 0.05) between the FM and 1000 Genomes subpopulations are represented by filled circles

