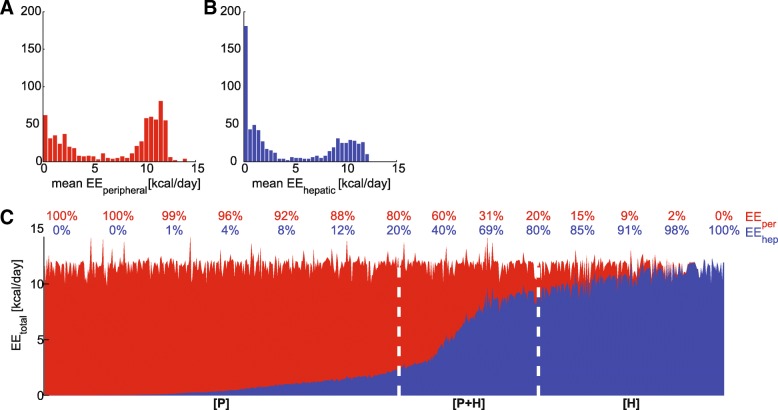
Fig. 3.
Peripheral (red) and hepatic (blue) contribution of energy expenditure. a and b include histograms of the mean energy expenditure. c shows the relative contribution (numbers above graph) where each vertical line represents a single virtual individual. The division in subgroups [P], [P + H], and [H] is indicated by the white dashed lines

