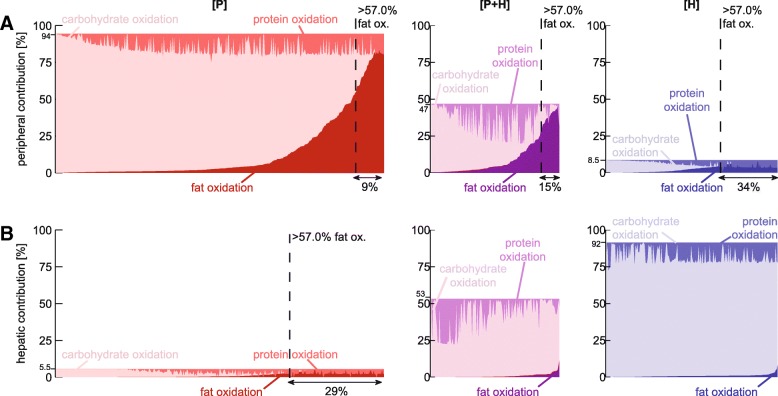
Fig. 4.
Contribution of carbohydrate and fat oxidation to the peripheral (a) and hepatic (b) energy expenditure. In subgroup [P] (left-hand side panels), energy is predominantly utilized in the periphery (> 80% originates from the peripheral compartment). In subgroup [H] (right-hand side panels), energy is predominantly utilized in the liver (> 80% originates from the hepatic compartment). Subgroup [P + H] (panels in the center) is an intermediate subgroup in which both periphery and liver contribute significantly (> 20% originates from peripheral compartment and > 20% originates from the liver). The dark colored areas (bottom right) correspond with fat oxidation, the medium colored areas (top left) indicate protein oxidation and the light areas (middle) specify carbohydrate oxidation. The dashed line bounds of the acceptable physiological range on the lipid oxidation ratio (at least 57% originates from lipid substrates). The fraction of individuals that adheres to this constraint is depicted below each graph

