
Fig. 2.
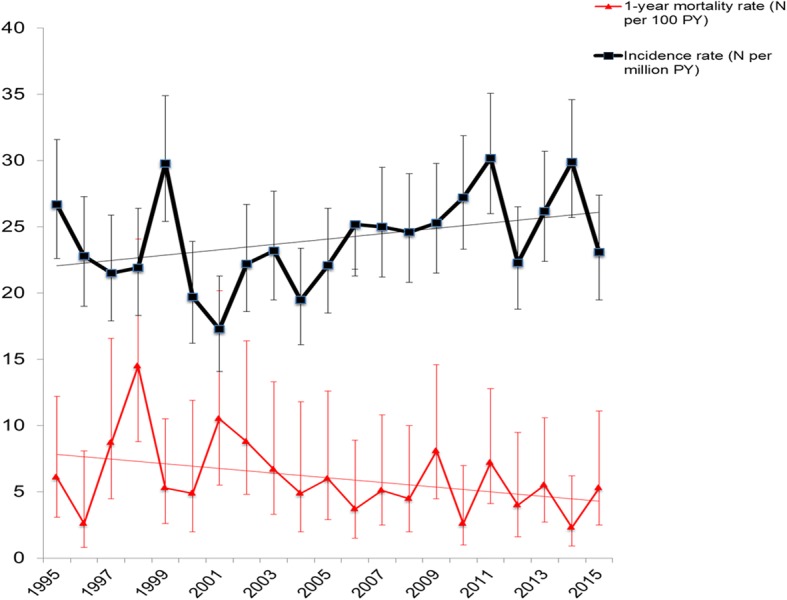
Temporal trends in overall incidence and 1-year mortality rates between 1995 and 2015. Incidence rate (black line) and mortality rate (red line) with 95% confidence intervals of estimate
Official websites use .gov
A
.gov website belongs to an official
government organization in the United States.
Secure .gov websites use HTTPS
A lock (
) or https:// means you've safely
connected to the .gov website. Share sensitive
information only on official, secure websites.
Temporal trends in overall incidence and 1-year mortality rates between 1995 and 2015. Incidence rate (black line) and mortality rate (red line) with 95% confidence intervals of estimate