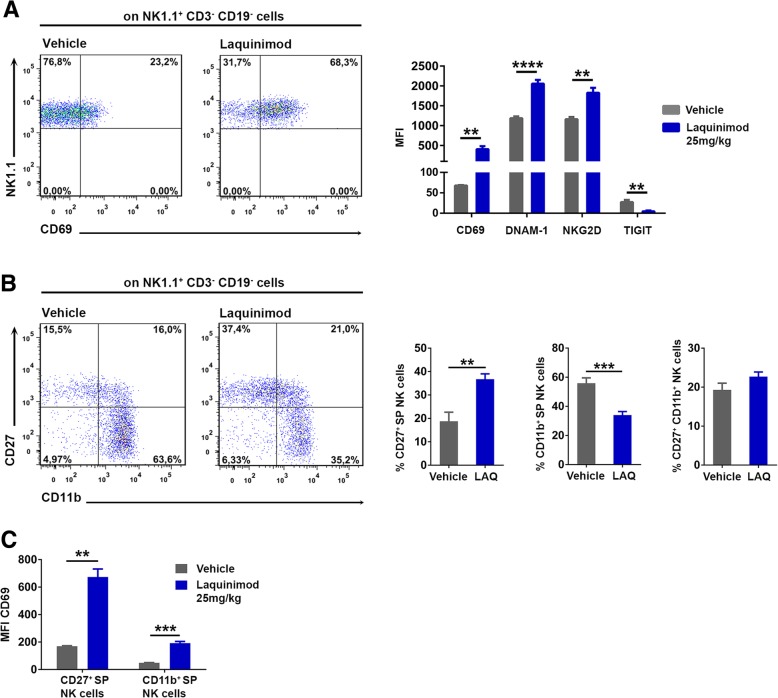
Fig. 1.
Laquinimod therapy activates NK cells. a Representative flow cytometry analysis of NK1.1/CD69 expression and quantification of activating and inhibitory NK cell receptors on day 11 after immunization with MOG35–55 and laquinimod (blue bars) or vehicle therapy (gray bars). Data are presented as mean ± S.E.M. and are representative of two independent experiments with five animals/group. **P < 0.01, ***P < 0.001, ****P < 0.0001, unpaired t test with Welch’s correction. b Representative flow cytometry analysis of splenic NK cell subsets defined by CD27/CD11b expression on day 11 after laquinimod or vehicle therapy of MOG35–55-immunized animals. Data are presented as mean ± S.E.M. and are pooled from three independent experiments with nine animals/group. **P < 0.01, ***P < 0.001, unpaired t test. c Quantification of CD69 expression by flow cytometry on NK cell subsets. Data are presented as mean ± S.E.M. and are representative of two independent experiments with five animals/group. **P < 0.01, ***P < 0.001 unpaired t test

