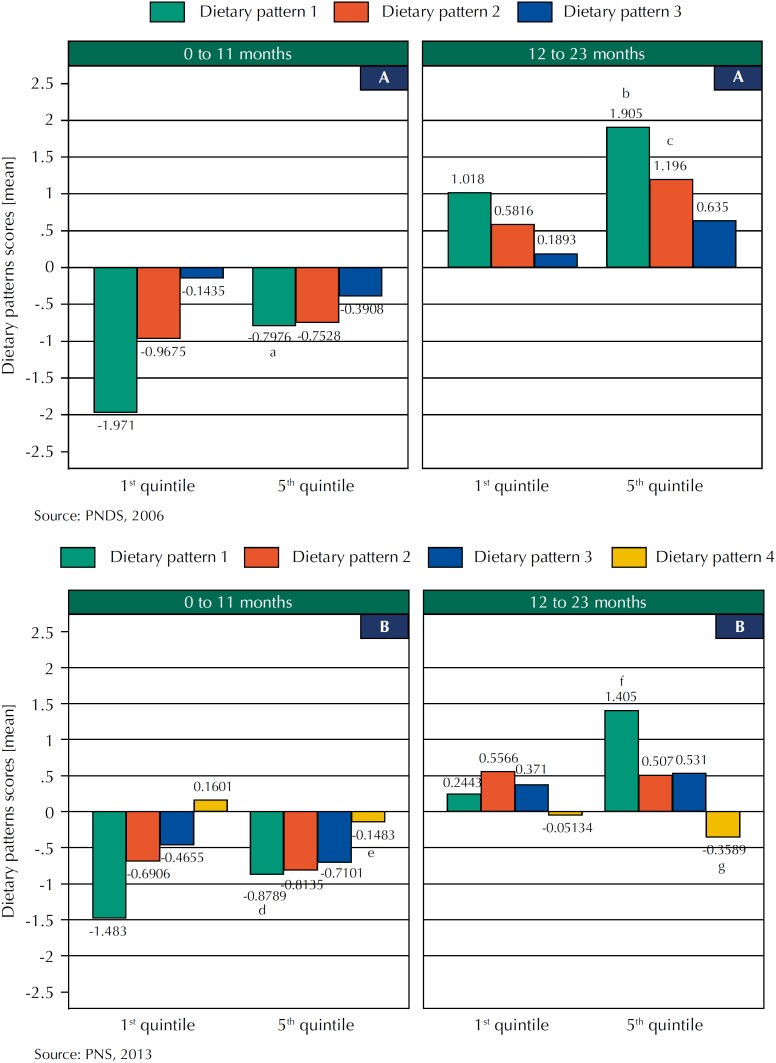
Figure. Means of dietary pattern scores by the poorest (1st) and richest (5th) wealth index and age range in 2006 (A) and 2013 (B). Brazil, PNDS (2006) and PNS (2013).
Comparison between 1st quintile versus 5th quintile by age range: ap = 0.016; bp = 0.000; cp = 0.012; dp = 0.023; ep = 0.000; fp = 0.003; gp = 0.005.

