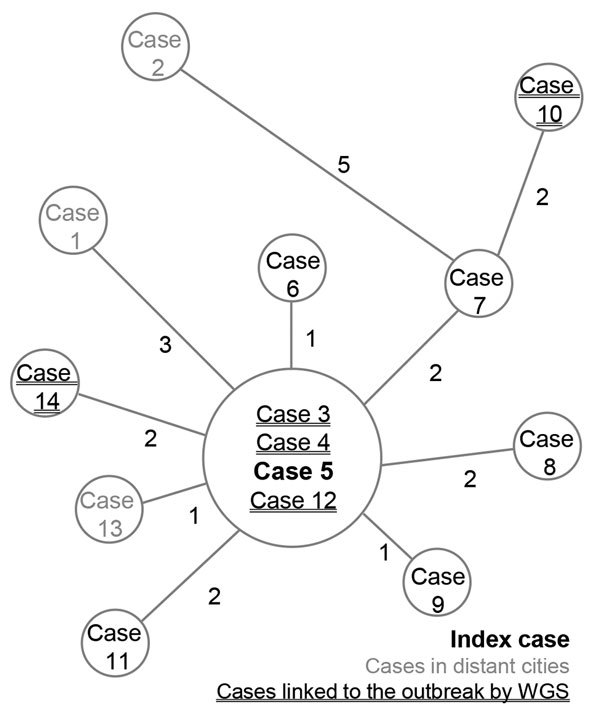
Figure 1.

Minimum-spanning tree of single-nucleotide polymorphism differences from 14 Mycobacterium tuberculosis outbreak isolates, France, 2017–2018. Cases were numbered according to sampling chronology. Sizes of circles are proportional to the number of isolates with identical genomes; numbers adjacent to lines indicate number of single-nucleotide polymorphism differences between each node. WGS, whole-genome sequencing.
