
Fig. 2.
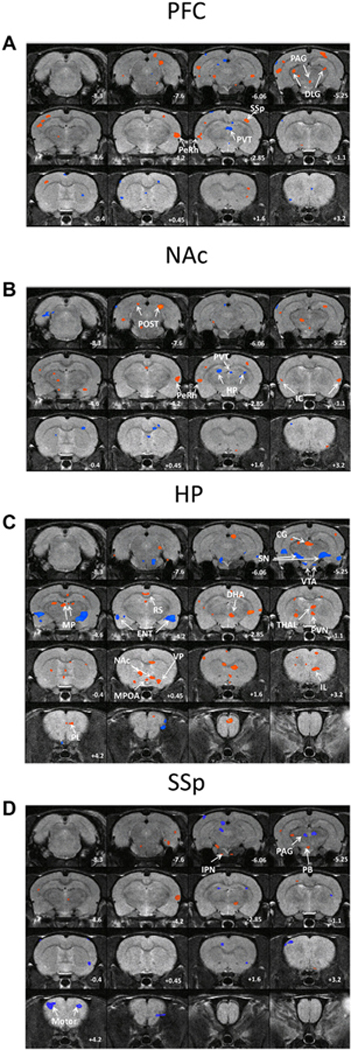
A–D Composite maps of significant changes in resting state functional connectivity in ECSS animals compared to controls using the prefrontal cortex (A), nucleus accumbens (B), hippocampus (C), and primary somatosensory cortex (D) as seeds. Red denotes increased connectivity between the seed and denoted region in ECSS animals, blue denotes decreased connectivity. Numerical values are coronal position relative to bregma. (For interpretation of the references to colour in this figure legend, the reader is referred to the web version of this article.)