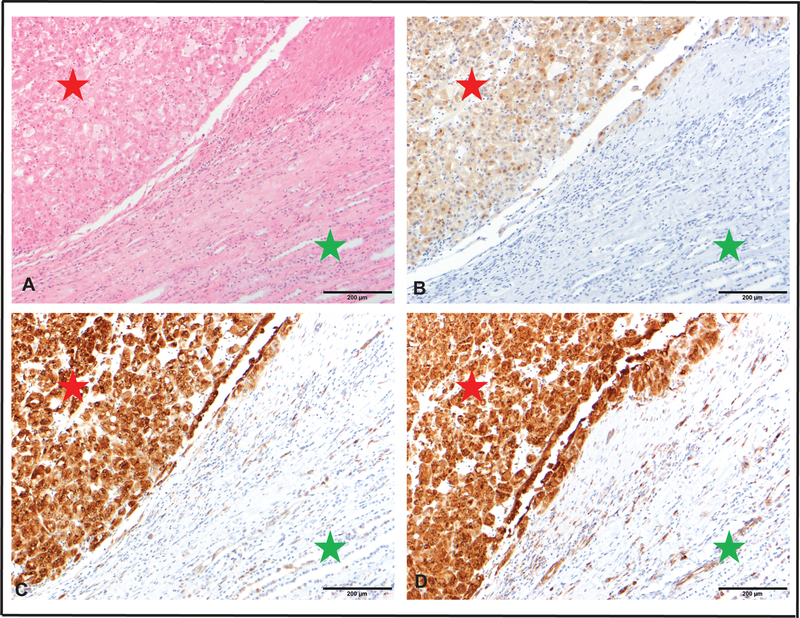
FIGURE 2.
Bi-allelic loss of TSC genes activates mTOR pathway in ESC-RCC A. H&E stained section from ESC-RCC showing characteristic morphological features (red star) and background benign renal parenchyma (green star). Scale bar 200 μm. B. Tumor cells diffusely and moderately express phospho-4E-BP1 (red star) with negative expression in the background renal parenchyma (green star). Scale bar 200 μm. C. Tumor cells diffusely and strongly express phospho-S6 Rib P D68.F8 (red star) with weak expression in certain cell types in the background renal parenchyma (green star). Scale bar 200 μm. D. Tumor cells diffusely and strongly express phospho-S6 Rib P D57.2.2E (red star) with weak to moderate expression in certain cell types within the background renal parenchyma (green star). Scale bar 200 μm.

