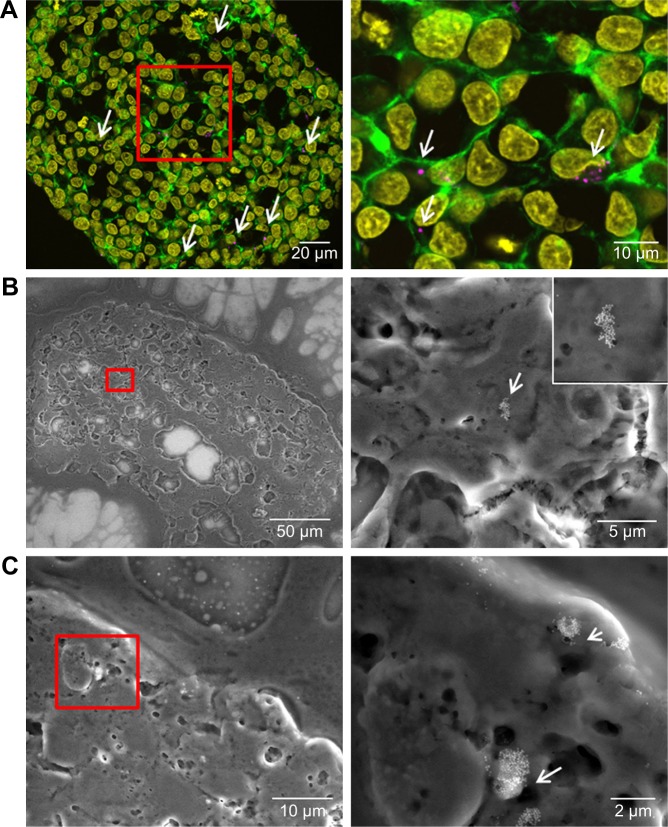
Figure 7.
Distribution of SiO2 NPs in HepG2 spheroids added at the beginning of spheroid formation.
Notes: 100 µg mL−1 SiO2 NPs were applied at seeding day 0 for 7 days. For imaging, spheroids were fixed and cut into 10-µm-thick cryoslices. Representative images of the samples are shown. (A) CLS images of the spheroids. After preparation of cryoslices, samples were stained for CLS microscopy. The cell nucleus (yellow), cytoskeleton (green), and SiO2 NPs (magenta) are imaged. Red box indicates the detailed image position, which is derived from a maximum projection, shown on the right. (B, C) Backscattered electron micrographs of a spheroid overview (left) and a detailed image (right) are shown. Red box indicates the detailed image position. Arrows highlight the localization of SiO2 NPs in the spheroid.
Abbreviations: CLS, confocal laser scanning microscopy; NPs, nanoparticles.

