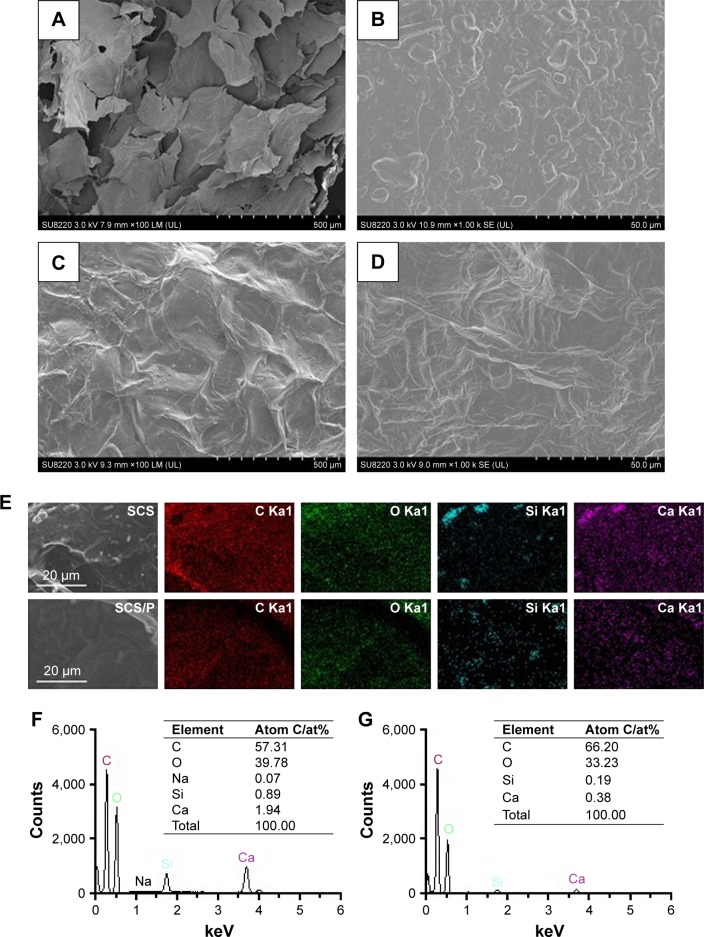
Figure 2.
Morphology and composition analysis.
Notes: SEM images of SCS (A and B) and SCS/P (C and D) scaffold. (E) Selected area on SCS and SCS/P scaffolds and the elemental distributions of C, O, Si, Ca. (F) Quantitative analysis of all the elements on the SCS scaffold surface. (G) Quantitative analysis of all the elements on the SCS/P scaffold surface.
Abbreviations: SEM, scanning electron microscopy; SCS, silk/calcium silicate/sodium alginate; SCS/P, silk/calcium silicate/sodium alginate/PVA.

