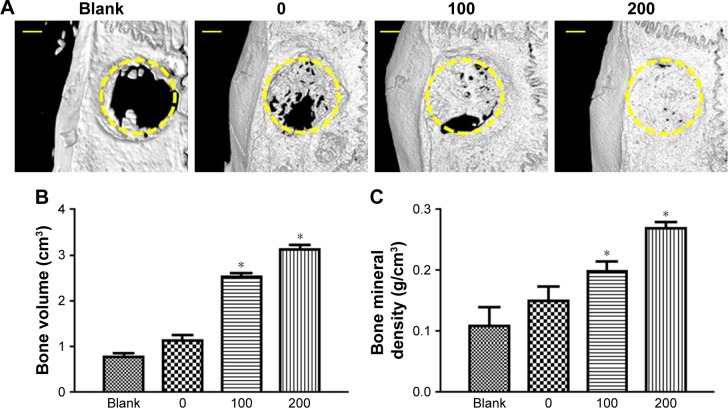
Figure 7.
Evaluation of new bone formation in calvarial defects at 8 weeks post-implantation via µCT.
Notes: (A) Representative µCT images of calvarial defects showing mineralized bone formation after treatment with no implant (blank), SCS/P scaffold (0), i/SCS/P containing 100 ng irisin (100), and i/SCS/P containing 200 ng irisin (200), respectively. The yellow circle indicates the original defect margin. Scale bar: 1 mm. Quantitative analysis of (B) the volume of the regenerated BV and (C) BMD. *P<0.05, compared with blank and 0 groups.
Abbreviations: µCT, microcomputed tomography; SCS/P, silk/calcium silicate/sodium alginate/PVA; i/SCS/P, irisin-loaded silk/calcium silicate/sodium alginate/PVA; BV, bone volume; BMD, bone mineral density.

