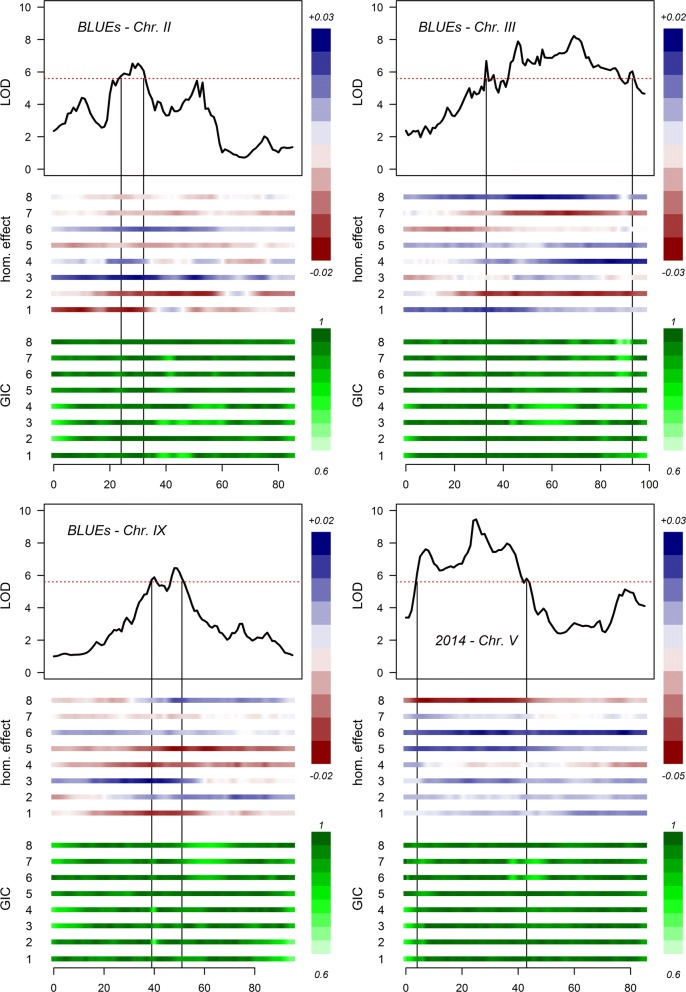
Fig. 5.
Contribution of homologues on the values of protein content for the QTLs identified on chromosomes 2 (top left), 3 (top right), 5 (bottom right) and 9 (bottom left). Homologues (hom.) 1 to 4 originate from Altus (parent 1) and homologues 5 to 8 from Colomba (parent 2). The upper vertical scale in blue to red represents the contribution of the homologues on the values of protein content. The lower vertical scale in dark green to light green represents the genotypic information coefficient (GIC) of the homologues. The horizontal red dashed line in the LOD plot represents the permutation-based LOD threshold. The horizontal scale below the homologue box represents the genetic (cM) positions. (Color figure online)

