Fig. 2.

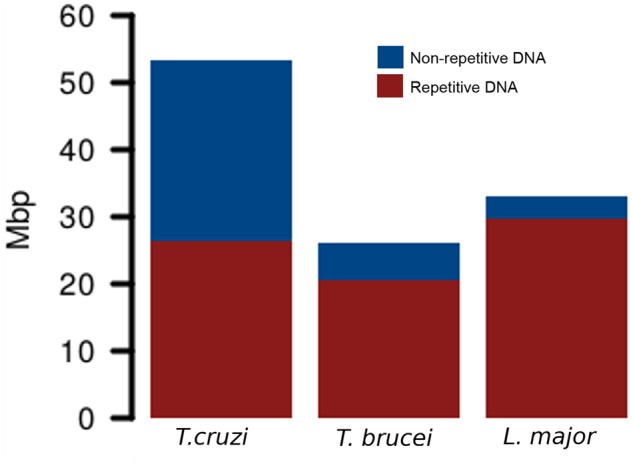
—Comparison of Trypanosoma cruzi, T. brucei, and Leishmania major genomes. Bar plots represent the total genome content in Mega base pairs (Mbp). In each genome, repetitive and nonrepetitive DNA is depicted.

—Comparison of Trypanosoma cruzi, T. brucei, and Leishmania major genomes. Bar plots represent the total genome content in Mega base pairs (Mbp). In each genome, repetitive and nonrepetitive DNA is depicted.