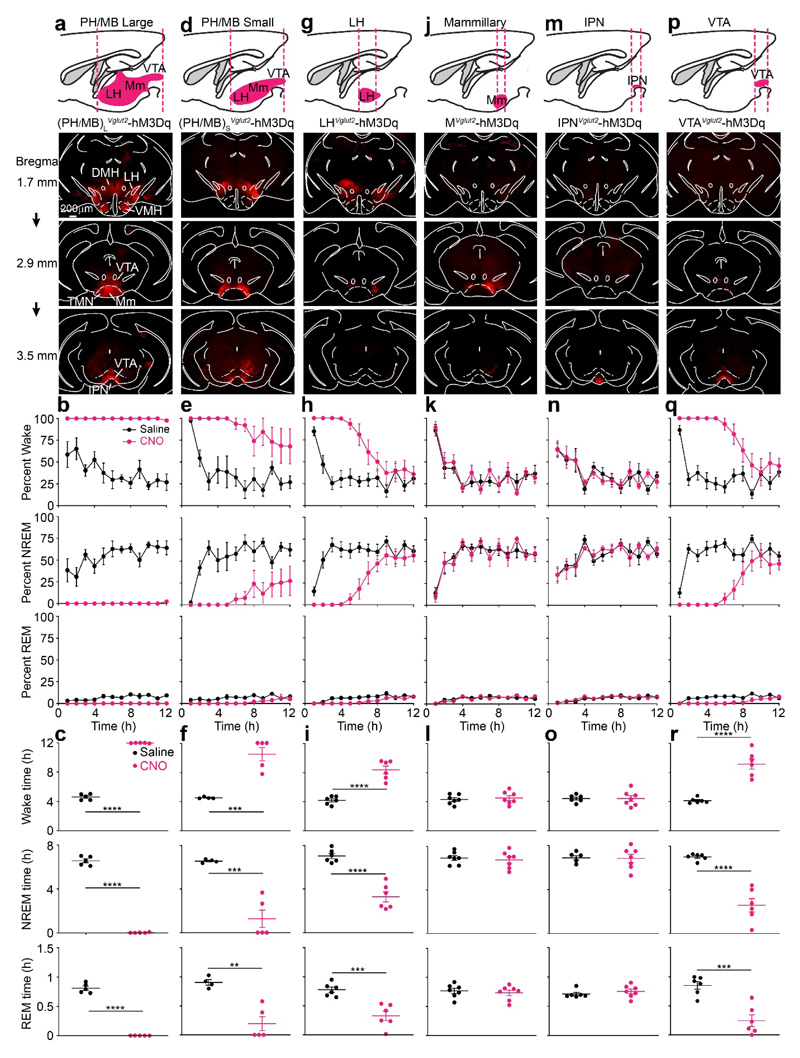
Fig. 1. Chemogenetic mapping for novel glutamatergic areas in the posterior hypothalamus and midbrain that promote wakefulness identifies the VTA.
AAV-DIO-hM3Dq-mCherry was injected into different areas of the brain of Vglut2-ires-Cre mice. AAV expression was determined by immunocytochemistry for mCherry (red). The images show the actual mCherry staining.
(a, b and c) AAV injection into a large volume of posterior hypothalamus and midbrain (PH/MB)L. The experiment in (a) was repeated independently 5 times. The graphs show percent of wake, NREM and REM sleep and how these states vary with saline (n=5 mice) or CNO (n=5 mice) i.p. injections.
(d, e and f) AAV injection into a smaller volume of posterior hypothalamus and midbrain, and sleep-wake states scored as above after saline (n=4 mice) or CNO (n=5 mice) i.p. injections. The experiment in (d) was repeated independently 5 times.
(g, h and i) AAV injection was restricted to the LH, and sleep wake states scored following saline and CNO injection after saline (n=6 mice) or CNO (n=6 mice) i.p. injections. The experiment in (g) was repeated independently 6 times.
(j, k and l) AAV injection was restricted to the mammillary area, and sleep wake states scored following saline (n=7 mice) and CNO (n=7 mice) i.p. injection. The experiment in (j) was repeated independently 5 times. See Supplementary Fig. 2a for examples of hM3Dq-mCherry expression in individual mice.
(m, n and o) AAV injection was restricted to the interpeduncular nucleus (IPN), and sleep wake states scored following saline (n=6 mice) and CNO (n=7 mice) i.p. injection. The experiment in (m) was repeated independently 6 times. See Supplementary Fig. 2b for examples of individual hM3Dq-mCherry expression.
(p, q and r) AAV injection was restricted to the VTA, and sleep wake states scored following saline (n=6) and CNO (n=6) i.p. injection. The experiment in (p) was repeated independently 6 times. See Supplementary Fig. 2c for examples of hM3Dq-mCherry expression in individual mice.
DMH, dorsomedial hypothalamus; LH, lateral hypothalamus; PH, posterior hypothalamus; IPN, interpeduncular nucleus; MM, medial mammillary area; TMN, tuberomammillary area; VMH, ventromedial hypothalamus; VTA ventral tegmental area. All error bars represent the SEM. **p<0.01, ***p<0.001, ****p<0.0001; two-sided unpaired t-test. For detailed statistics information, see Supplementary Table1.

