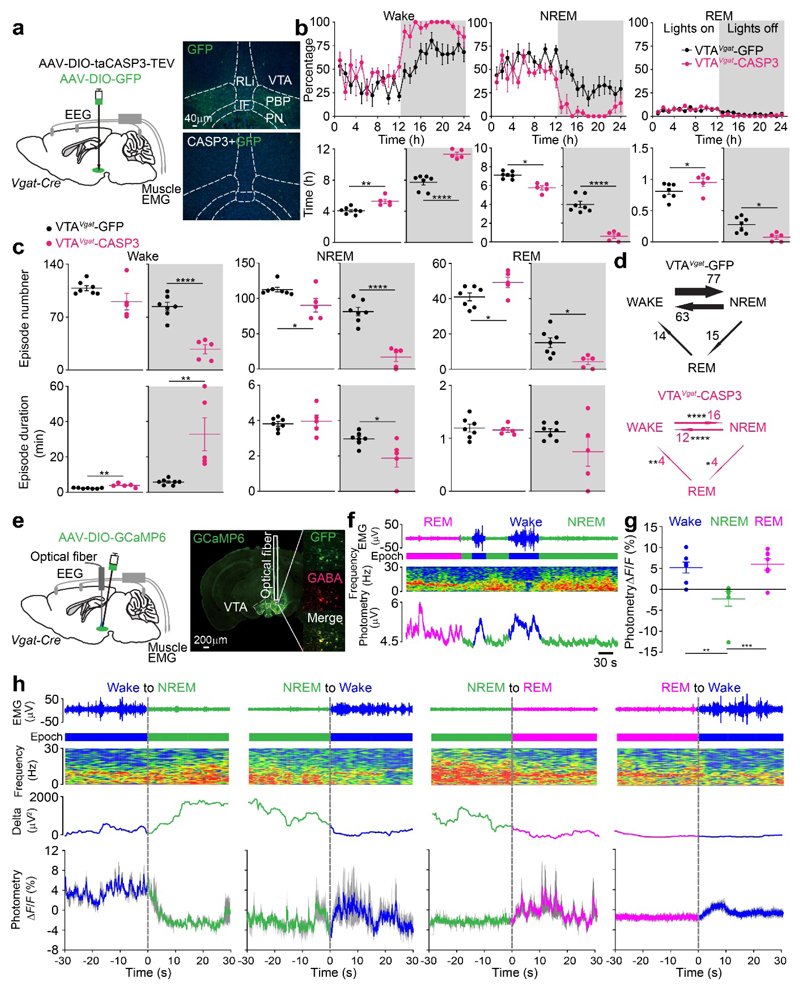
Fig. 6. VTAVgat neurons inhibit wakefulness. Lesioning of VTAVgat neurons produces extended wakefulness, but VTAVgat neurons are selectively wake- and REM-active.
(a) Lesioning of VTAVgat neurons. Injection of AAV-DIO-GFP (control) or AAV-DIO-taCASP3-TEV into the VTA area of Vgat-ires-Cre mice. Pictures show GFP control expression in the VTA area of VTAVgat-GFP mice and that this GFP expression has been greatly diminished in the caspase treated mice. The experiment was repeated independently 5 times. IF, interfasicular nucleus; PBP, parabrachial pigmented nucleus; PN, paranigral nucleus; PBP, parabrachial pigmented nucleus; RLi, rostral linear nucleus
(b) Lesioning of VTAVgat neurons increases wakefulness. Percentage of wake, NREM and REM sleep in control VTAVgat-GFP mice (n=7 mice) and VTAVgat-CASP3 mice (n=5 mice), and the total vigilance times in the “lights on” and “lights off” periods.
(c, d) Lesioning of VTAVgat neurons reduces the transitions between vigilance states and stabilizes wakefulness. Episode number and duration for wake, NREM and REM sleep, and vigilance state transitions during the “lights off” periods in VTAVgat-GFP control mice (n=7 mice) and VTAVgat-CASP3 mice (n=5 mice).
(e) Fiber photometry for Ca2+ levels in VTAVgat neurons. Injection of AAV-DIO-GCaMP6 into the VTA of Vgat-ires-Cre mice. GCaMP6 expression can be detected in the VTA area and was co-stained with GABA. The trace of where the optical fiber was placed is illustrated. The experiment was repeated independently 7 times.
(f) Fiber photometry for VTAVgat neurons. Neurons are more active in wake and REM sleep. Ca2+ photometry spectra (bottom trace) recorded in the VTA of VTAVgat-GCaMP6 mice aligned with the EEG spectra (middle trace) and EMG (top trace) during wakefulness, NREM and REM sleep. “Epoch” indicates vigilance state: blue: wake; green: NREM sleep; magenta, REM sleep.
(g) Fiber photometry for VTAVgat neurons. ΔF/F ratio of the Ca2+ photometry signal in VTAVgat-GCaMP6f mice during wakefulness, NREM sleep and REM sleep (n=7 mice; 41 trials).
(h) Fiber photometry for VTAVgat neurons. Detail of how the Ca2+ signal in Vgat neurons of VTAVgat-GCaMP6 mice changes at the boundaries of the vigilance states (n=7 mice). “Epoch” indicates vigilance state: blue, wake; green, NREM sleep; magenta: REM sleep. Grey shaded regions represent SEM.
*p<0.05, **p<0.01, ****p<0.0001; For b-d, two-sided unpaired t-test, for g, one-way ANOVA. All error bars represent the SEM. For detailed statistics information, see Supplementary Table1.

