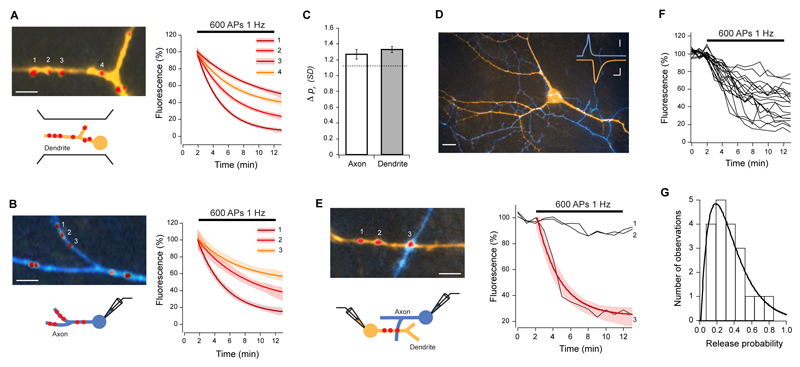
Figure 1. Variability of release probability.
Release probability was measured by labeling synapses with FM-dye and monitoring destaining rates upon action potential stimulation, delivered by field stimulation (A), or during single (B) and paired (E) whole-cell recordings. (A) Left, dendrite (orange) with FM4-64 labeled synapses (red). Right, destaining curve fits with 95% confidence interval (shaded areas) for the numbered synapses show a wide range of release probabilities for synapses in the same dendritic branch. (B) Left, axon (blue) with several synapses (red), and respective destaining curve fits (right), also show very different prs for synapses along single axons. (C) Summary data of similarity comparisons for all synapses in a branch of dendrite or axon, showing that the mean pr difference is not significantly different from the average pr difference expected by chance (1.13 SDs, Wilcoxon rank sum test for axon P = 0.4241, dendrite P = 0.2079). (D) Epifluorescence image of axon (blue) making multiple synaptic contacts (red, FM4-64) with a postsynaptic cell (orange). Inset: representative traces of AP (blue) and evoked EPSC (orange). Scale bars, 15 μm; inset, 2 ms, 20 mV (top), 100 pA (bottom). (E) Stimulation of the presynaptic cell selectively destains FM4-64 fluorescence from the synapse belonging to the labeled axon (3), and not from those originating from unlabeled axons (1,2). Red line is a single exponential fit. (F, G) Destaining traces from 19 synapses from one connection (F) and corresponding release probability frequency histogram (G). Solid line is gamma function fit (λ = 5.8, n = 3).

