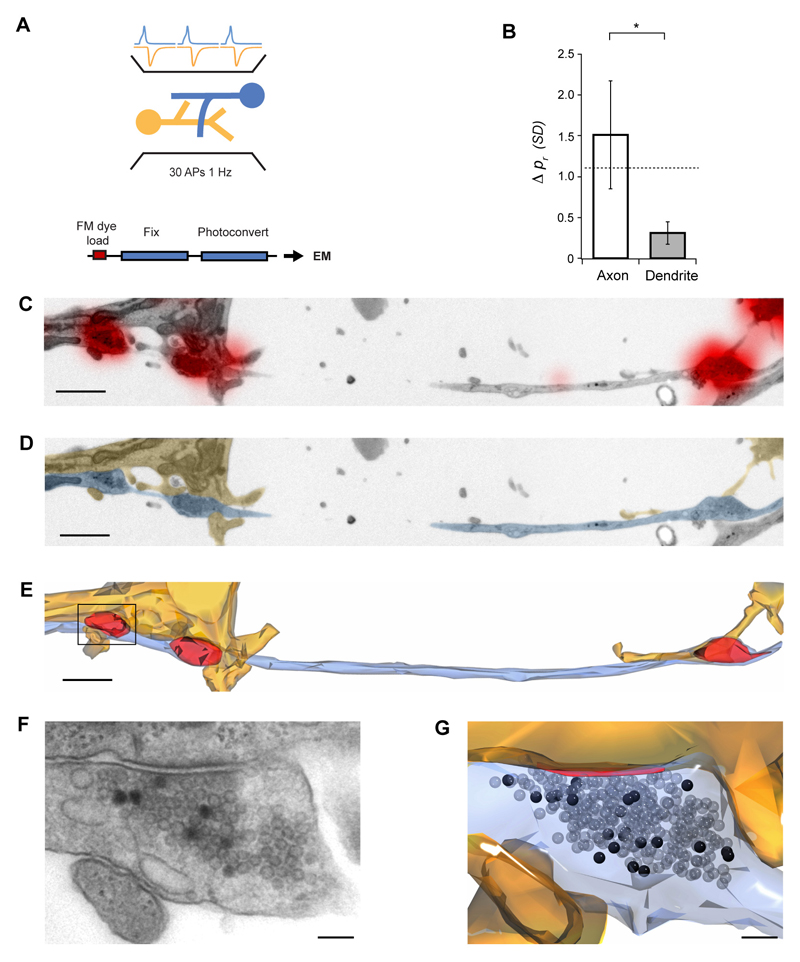
Figure 3. Ultrastructural analysis of release probability.
(A) Experimental scheme. FM-dye was loaded into synapses with 30 APs delivered by field stimulation, and samples were photoconverted, serially sectioned, imaged and reconstructed. Release probability was estimated by counting the number of photoconverted vesicles. (B) Summary of similarity comparisons, showing that synapses on the same dendrite have very similar release probabilities (axon vs. dendrite, P = 0.0438). Dashed line indicates the expected difference due to chance from Monte Carlo simulations (1.1 SDs, Wilcoxon rank sum test for axon P = 0.8750, dendrite P = 0.0156). (C-E) Representative experiment showing one axon (blue) making synapses (red) with two different dendrites (orange). (C) Low magnification electron micrograph with FM-dye fluorescence overlaid. (D) Same micrograph as in D with axon and dendrite colored for clarity. (E) 3-D reconstruction with vesicle clusters in red. (F) Higher magnification micrograph of the boxed synapse in F where photoconverted vesicles are clearly seen. (G) 3-D reconstruction of the same synapse with photoconverted vesicles (black) and active zone (red). Scale bar in (C-E), 1 μm, (F, G), 100 nm. Error bars are ± s.e.m.

