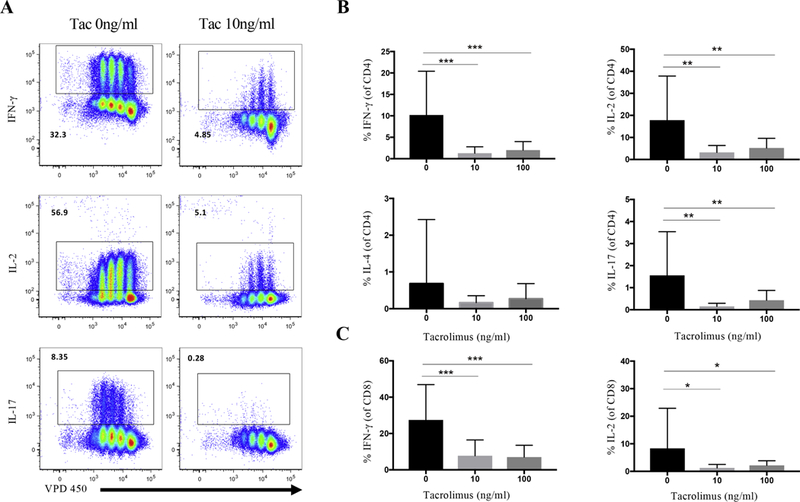
Fig. 3.

Tacrolimus suppresses CD4 and CD8 T cell function. (A) Gating on CD4+ T cells, intracellular cytokine analysis for IFN-γ, IL-2, IL-17A production (Y axis) and violet proliferation dye VPD 450 (X axis), in absence of tacrolimus (left) and 10ng/ml tacrolimus (right). (B) Comparison of CD4+IFN-γ+, CD4+IL-2+, CD4+IL-4+ and CD4+IL-17+ frequencies in CD4+ T cells among without tacrolimus (left black column), 10ng/ml tacrolimus (middle light grey column), and 100ng/ml tacrolimus (right dark grey column). (C) Comparison of CD8+IFN-γ+ and CD8+IL-2+ frequencies in CD8+ T cells among without tacrolimus (left, black column), 10ng/ml tacrolimus (middle, light grey column), and 100ng/ml tacrolimus (right, dark grey column). Statistical significance is represented as follows: * p≤0.05; ** p≤0.01; *** p≤0.001. Results are shown from six independent experiments, analyzing a total of 17–19 patients.
