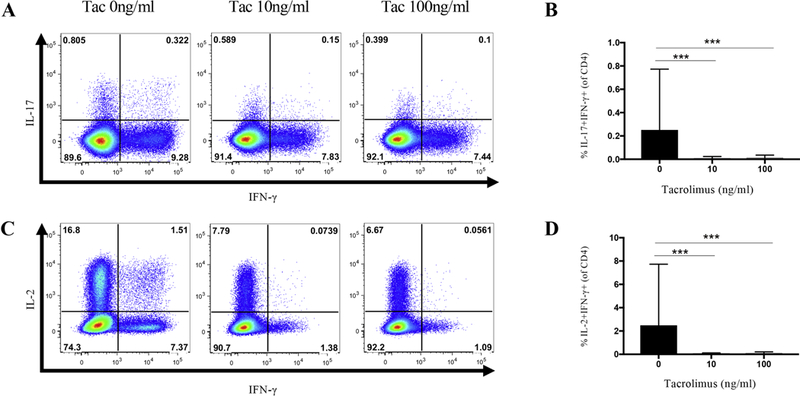
Fig. 4.

Comparison of CD4+IL-17+IFN-γ+ and CD4+IL-2+IFN-γ+ cells in the absence and presence of tacrolimus. (A) Intracellular cytokine staining for IL-17+IFN-γ+ pathogenic Th17 cells in the presence and absence of tacrolimus. (B) Composite data comparing the frequency of IL-17+IFN-γ+ pathogenic Th17 cells in 0ng/ml, 10ng/ml, and 100ng/ml of tacrolimus. (C) Intracellular cytokine staining for IL-2+IFN-γ+ CD4 T cells in the presence and absence of tacrolimus. (D) Composite data comparing the frequency of IL-2+IFN-γ+ CD4 T cells in 0ng/ml, 10ng/ml, and 100ng/ml of tacrolimus. Statistical significance is represented as follows: * p≤0.05; *** p≤0.001. Results are shown from five independent experiments, analyzing a total of 15–30 patients (0ng/ml N=30; 10ng/ml N=17; 100ng/ml N=15).
