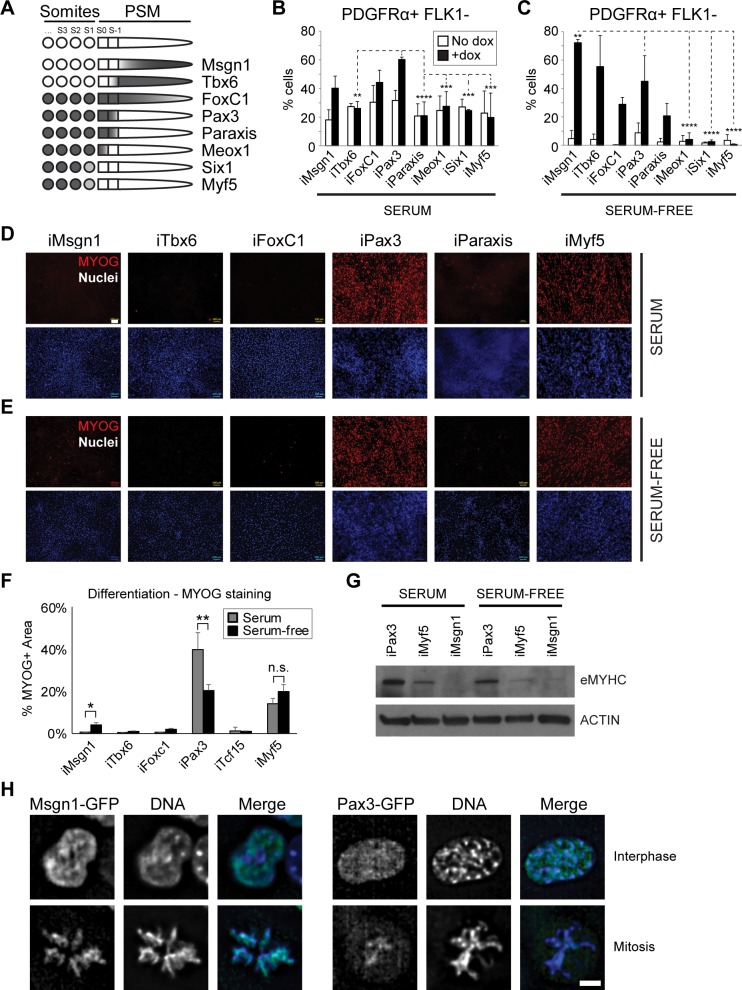
Fig 1. Distinct functions of Msgn1, Pax3, and Myf5 during mesoderm specification.
(A) Schematic representation of the developmental expression pattern of the TFs analyzed in this study based on published literature [5–15]. (B-C) Graphs show the percentage of PDGFRα+FLK1− cells, measured by FACS, in day 5 EB cultures from A2lox-Pax3, A2lox-FoxC1, A2lox-Meox1, A2lox-Msgn1, A2lox-Myf5, A2lox-Paraxis, and A2lox-Six1 ES cell lines, using both serum (B) and serum-free (C) differentiation protocols. Mean + SD is shown from at least 3 biological replicates. **p < 0.01, ***p < 0.001, ****p < 0.0001. Differences are relative to the Pax3+dox group. (D-E) Immunofluorescence staining for MyoG in serum (D) and serum-free (E) day 10 cultures following 24-hour dox withdrawal. Images are representative of 3 biological replicates. MYOG (red); nuclei (blue). Bar: 100 μm. (F) Quantification of the MYOG+ area of the immunostaining images shown in Fig 1D and 1E. Graph represents mean + SD from at least 3 independent experiments. *p < 0.05, **p < 0.01. (G) Western blot of day 10 cultures (same as panel D-E) from serum- and serum-free differentiation of A2lox-Pax3, A2lox-Myf5, and A2lox-Msgn1 ES cell lines. eMYHC. ACTIN. (H) Live cell imaging of Msgn1-GFP and Pax3-GFP fusion proteins using wide-field microscopy followed by image deconvolution. Images are representative of 3 biological replicates, and the results were similar between serum- and serum-free differentiation. DNA was visualized using Hoechst 33342. Bar: 5 μm. Numerical values are available in S1 Data. dox, doxycycline; EB, embryoid body; eMYHC, embryonic myosin heavy chain; ES, embryonic stem; FACS, fluorescence-activated cell sorting; FoxC1, forkhead box C1; Meox1, mesenchyme homeobox 1; Msgn1, mesogenin 1; Myf5, myogenic factor 5; MyoG, myogenin; Pax3, paired box 3; PSM, presomitic mesoderm; Six1, sine oculis-related homeobox 1; Tbx6, T-box 6; TF, transcription factor.

