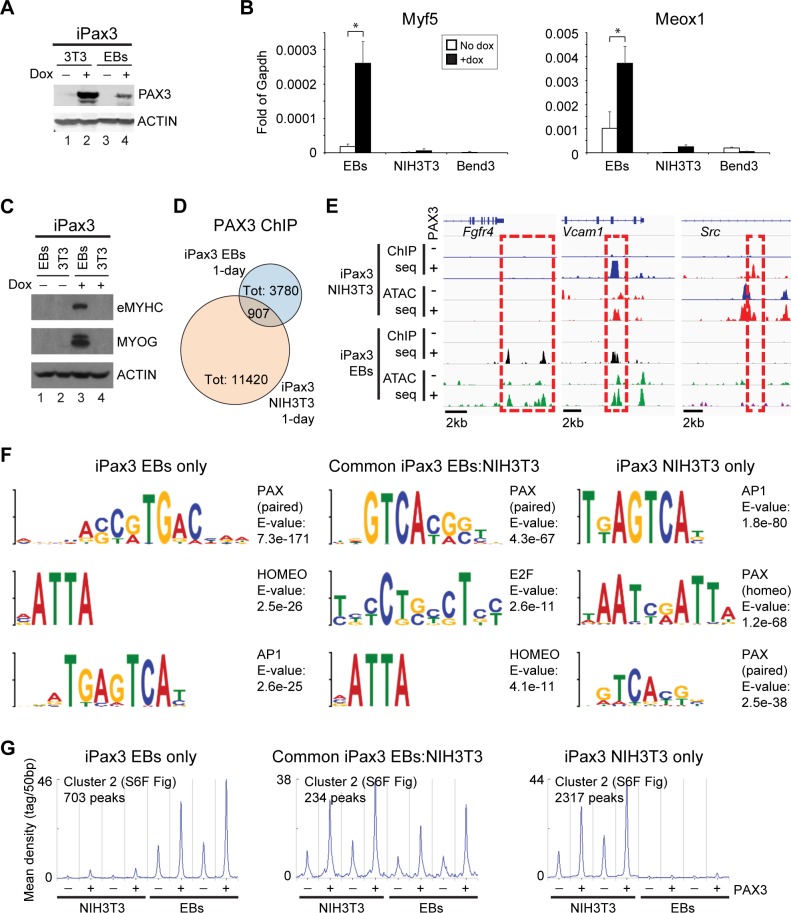
Fig 5. Pax3 does not activate the myogenic program in NIH3T3 fibroblasts and Bend3 endothelial cells.
(A) Pax3 induction in EBs and NIH3T3 iPax3 cells was assessed by western blot using antibodies to PAX3 and ACTIN. (B) qRT-PCR analysis for Myf5 and Meox1 in Pax3-induced (+dox) and noninduced (no dox) in day 4 EBs, NIH3T3, and Bend3 cells. Graph represents mean + SD from at least 3 independent experiments. *p < 0.05. (C) Cells from Pax3-induced (+dox) and noninduced (no dox) EBs and NIH3T3 cells were analyzed by western blot using antibodies specific for eMYHC, MYOG, and Actin. (D) Venn diagram displaying overlap between Pax3 genomic occupancy in 1-day EBs and NIH3T3 iPax3 cells. EBs-only peaks: 2,873; common EBs/NIH3T3 peaks: 907; NIH3T3-only peaks: 10,513. (E) IGV track displaying genomic occupancy and chromatin accessibility at the Fgfr4, Vcam1, and Src loci in PDGFRα+FLK1− cells isolated from Pax3-induced (+) and noninduced (-) day 4 EBs and Pax3-induced (+) and noninduced (-) NIH3T3 fibroblasts. Dashed red square shows Pax3-dependent regulation of chromatin accessibility. (F) Selected transcription factor motifs enriched at Pax3-bound loci from EBs-only peaks, common EBs/NIH3T3 peaks, and NIH3T3-only peaks. (G) Distribution of ATAC-seq reads across a subset of Pax3 ChIP-seq peaks generated using k-means clustering (from S6F Fig). Curves show chromatin accessibility at cluster 2 from EBs-only, common EBs/NIH3T3, and NIH3T3-only Pax3-bound peaks. Datasets are independent biological replicates. Graph represents the ATAC-seq reads overlapping to Pax3 ChIP-seq peaks (Pax3 peak center ± 3 kb). Numerical values are available in S1 Data. AP1, activator protein 1; ATAC-seq, assay for transposase-accessible chromatin sequencing; ChIP-seq, chromatin immunoprecipitation sequencing; dox, doxycycline; EB, embryoid body; eMYHC, embryonic myosin heavy chain; Fgfr4, fibroblast growth factor receptor 4; IGV, Integrative Genomics Viewer; iPax3, inducible-Pax3; MYOG, myogenin; Pax3, paired box 3; qRT-PCR, quantitative reverse transcription PCR; Src, Rous sarcoma oncogene; Tot, total; Vcam1, vascular cell adhesion molecule 1.

