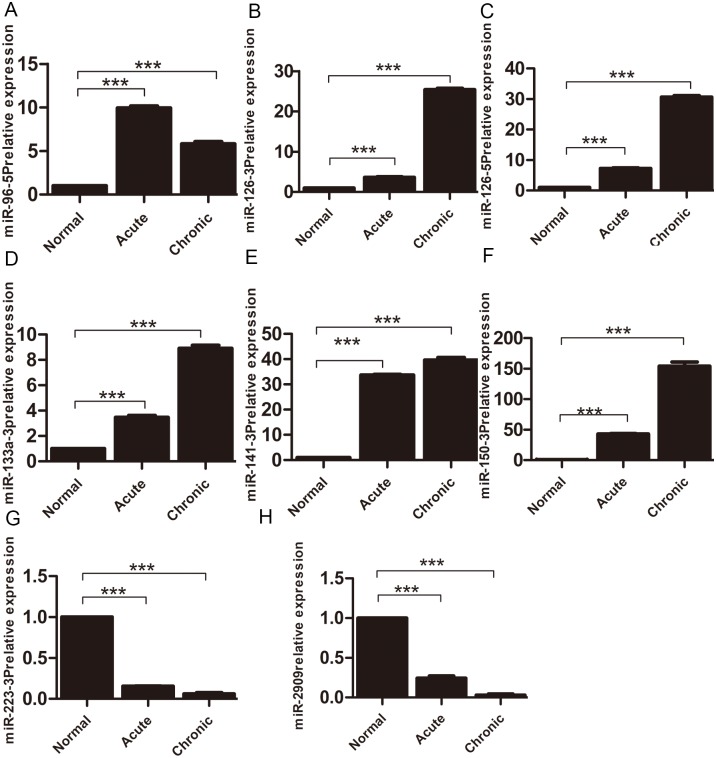
Fig 3. qPCR verification of miRNA microarray analysis results.
The relative expression of miR-96-5p (A), miR-126-3p (B), miR-126-5p (C), miR-133a-3p (D), miR-141-3p (E), miR-150-3p (F), miR-223-3p (G) and miR-2909 (H) in the acute inflammation model and the slow inflammation model group. All experiments were repeated in triplicate and analyzed by the 2-ΔΔCt method. *** p < 0.001; ** p < 0.01; * p < 0.05.

