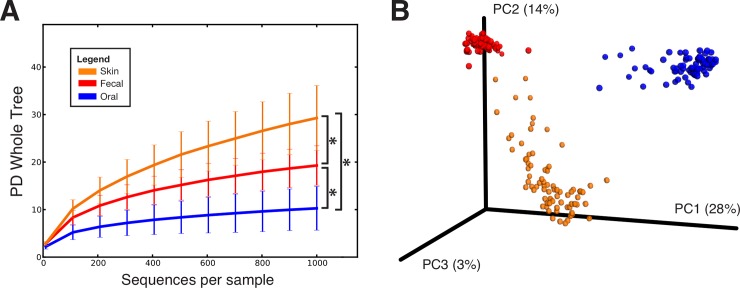
Fig 1. Alpha and Beta diversity of combined fecal, oral, and skin samples from all individuals.
(A) Rarefaction curves using Faith’s Phylogenetic Diversity (PD Whole Tree) metric at 1000 sequences per sample (* p<0.01, t-test) (B) PCoA plot using the unweighted UniFrac metric shows that samples cluster first by body site.

