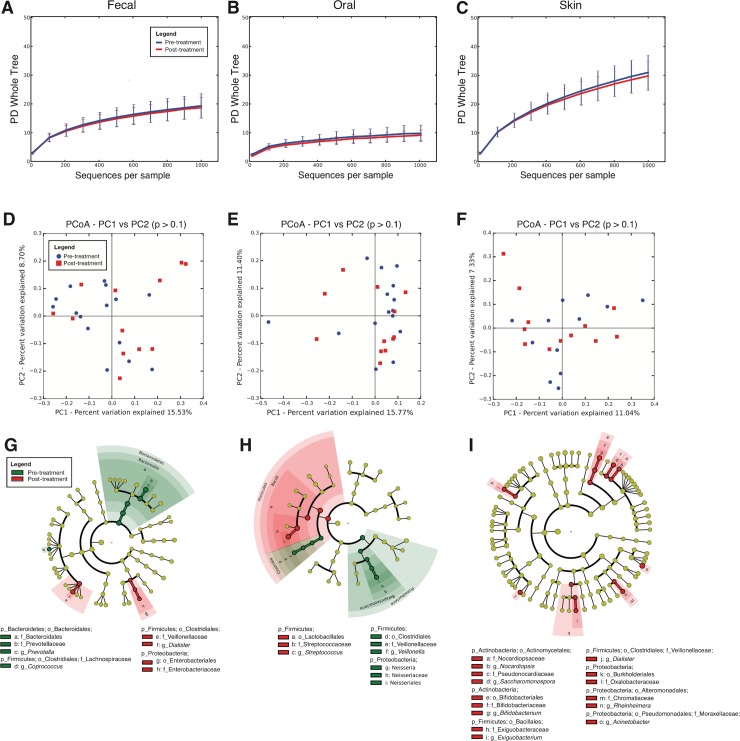
Fig 4. Effect of treatment on the microbiota of infected children.
(A-C) Rarefaction curves for fecal, oral, and skin samples of infected children pre-treatment (respectively 15, 12 and 12 samples) and post treatment (respectively 12in each body site), using Faith’s Phylogenetic Diversity (PD Whole Tree), rarefied at 1000 sequences per sample (D-F) PCoA plots for fecal, oral, and skin samples using the unweighted UniFrac metric. (G-I) Taxa that best differentiate between children before and after treatment using LEfSe (LDA score cutoff of 3.0 and a minimum mean abundance of 0.1%).

