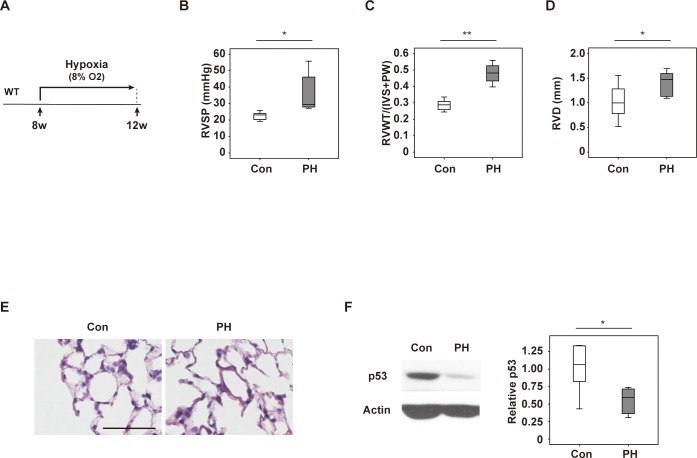
Fig 1. Generation of a mouse model of hypoxia-induced PH.
(A) Scheme for generating the mouse model of hypoxia-induced PH. Eight-week-old mice were housed in a hypoxic chamber (8% O2) for 4 weeks before experiments were performed. (B) Right ventricular systolic pressure (RVSP) in mice exposed to normoxia (Con) or hypoxia (PH) (n = 9, 8). (C, D) Right ventricular wall thickness (RVWT) (n = 8, 10) (C) and right ventricular diameter (RVD) (n = 8, 10) (D) in the indicated mice. (E) Hematoxylin and eosin (HE) staining of tissues harvested from the indicated mice. Scale bar = 50μm. (F) Western blot analysis of p53 in lungs from the indicated mice. The right panel displays quantification of p53 relative to the actin loading control (n = 5, 5). Data are shown as the mean ± s.e.m. *P<0.05, **P<0.01 by the 2-tailed Student’s t-test (B-D, F).

