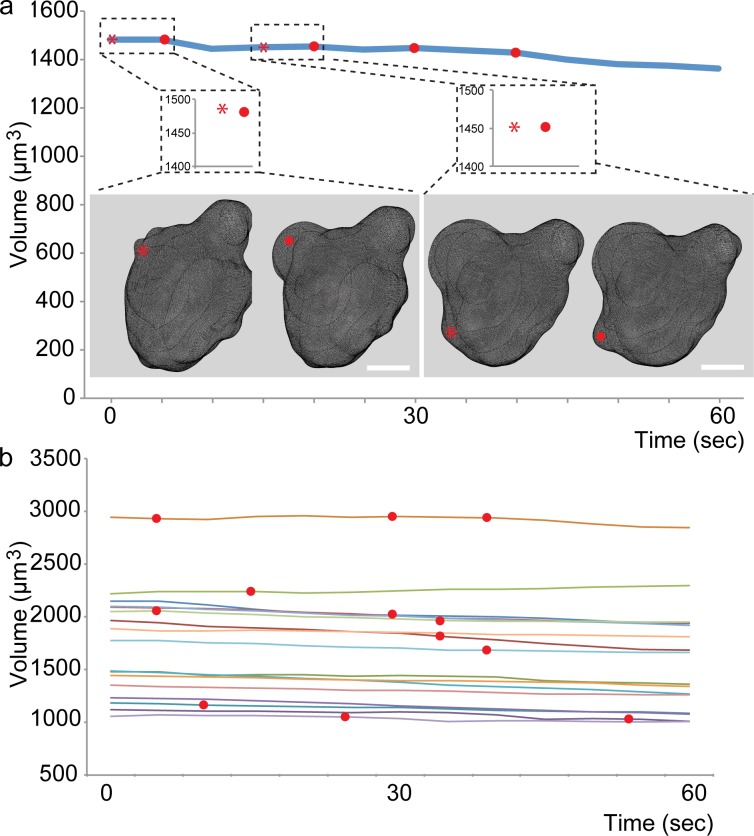
Fig 1. Cell volume during blebbing.
(A) A graph showing the volume of a representative PGC over the course of 60 seconds. The dashed rectangles show the magnifications of pre-bleb (asterisk) and bleb (red dot) time points. The images show the corresponding 3D reconstructions. (B) The graph shows the volume of 15 control PGCs over 60 seconds, in embryos injected with 800μM of control morpholino at one cell stage. The red dots mark time points when blebs were observed. Scale bar = 5 μm.

