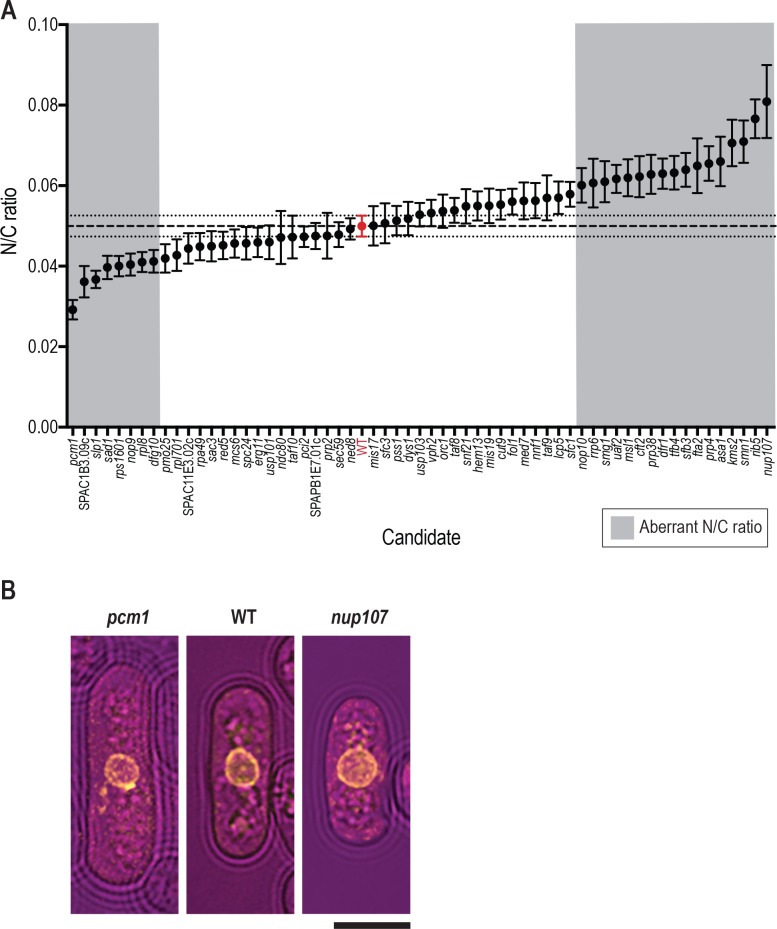
Fig 2. 25 gene deletion mutants with aberrant N/C ratios identified by the genetic screen.
(A) N/C ratio of wild type cells (red) and 60 gene deletion mutants in the third screen with nuclear envelope marker Ish1-yEGFP integrated in the deletion cassette. Mean plotted for each strain (n = 50 cells per strain). Error bars represent 95% confidence intervals. Dashed line represents wild type cell population mean. Dotted lines represent wild type 95% confidence intervals. Wild type strain used is the haploid derived from 5300 control strain (red). Aberrant N/C ratio candidates (grey background) were identified as described in Materials and Methods. (B) Images of an example cell for wild type (WT) and strains carrying deletions in pcm1 and nup107. Brightfield (magenta), Ish1-yEGFP (yellow). Scale bar: 5 μm.

