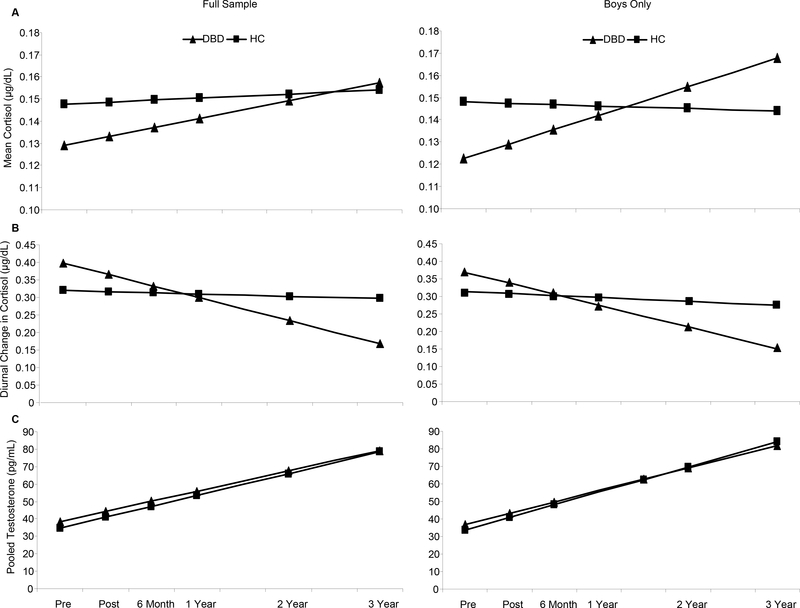
Figure 1.
Predicted Growth Curves by Treatment Condition Throughout Three-Year Follow-Up for: (a) Mean Cortisol: No treatment effects noted for the Full-Sample analysis. For boys only, the DBD group had significantly (b = −.03, p < .05) lower mean cortisol at the intercept with significantly increased mean cortisol concentrations over time than the HC group (b = .01, p < .01, ES = 1.00). (b) Diurnal Cortisol Change: There was a significant group by time interaction (b = −0.06, p < .01, ES = −2.35) for the Full Sample, indicating that the mean trajectory of diurnal change for the DBD group as a whole was significantly different when compared to the mean trajectory of the HC condition. This same group by time interaction remained significant in the Boys-Only analysis, (b = −0.05, p < .05, ES = −1.73). (c) Testosterone. There were no significant group differences at intercept or in the group by time interactions in either the Full-Sample or Boys-Only analyses. Note: No HC data were collected at Post and 6-month FU. Raw means for hormones are presented in Table 1.

