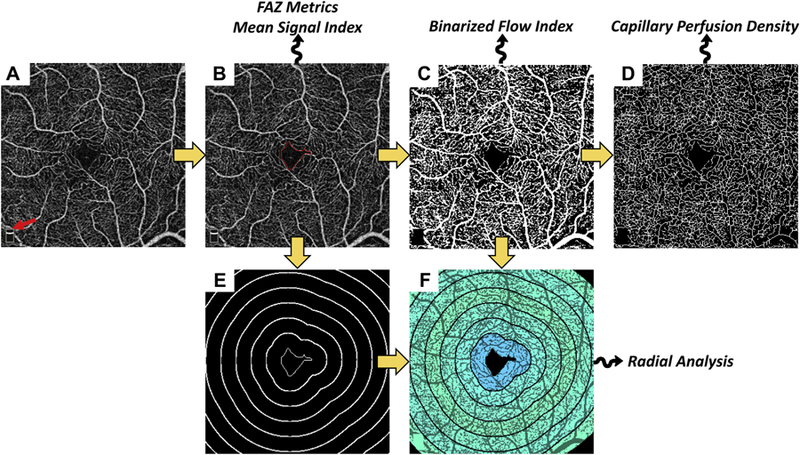
Figure 1.

Summary of processing steps used in analysis. Yellow arrows indicate the workflow; squiggly arrows indicate that the listed metrics are derived from that processing step. A, Input image; red arrow points to the scan-logo, which is removed from the analysis. B, Segmented foveal avascular zone (FAZ); red contour indicates FAZ boundary. This contour is used to derive the FAZ-based metrics. It is also used for computation of all metrics in which the FAZ is excluded. C, Binarized image. D, Skeletonized image. E, Level sets (bold white) of the closest-point-to-FAZ-contour function; the FAZ, in the center, is shown as a thin white contour. The level set contours are spaced by 250 μm. F, Radially averaged binarized flow index, using the contours from (E), overlaid on the binarized image.
