Figure 4.

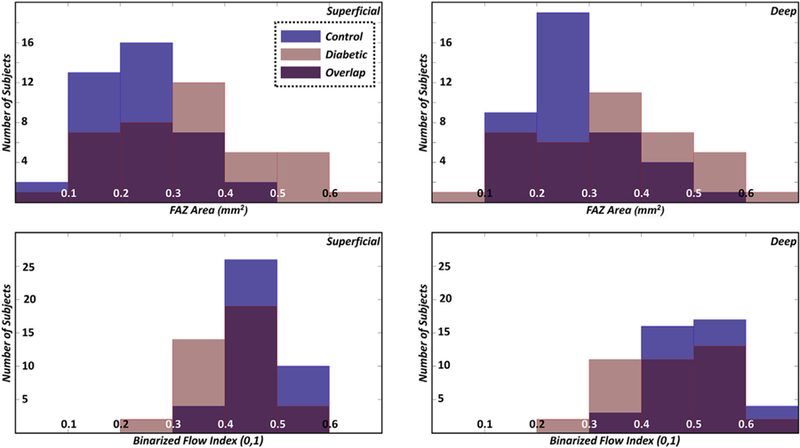
Histograms of the foveal avascular zone (FAZ) area (top row) and binarized flow index (bottom row); the left column corresponds to the superficial vasculature and the right column corresponds to the deep vasculature.

Histograms of the foveal avascular zone (FAZ) area (top row) and binarized flow index (bottom row); the left column corresponds to the superficial vasculature and the right column corresponds to the deep vasculature.