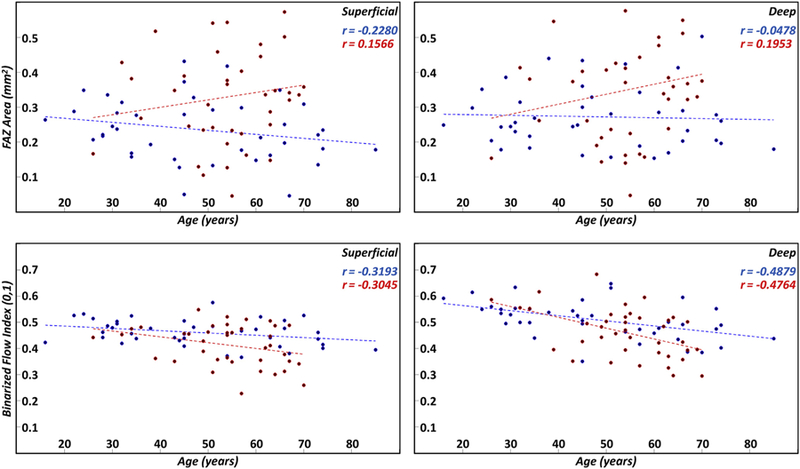
Figure 6.

Scatter plots of the foveal avascular zone (FAZ) area (first row) and binarized flow index (second row) as a function of age; the first column corresponds to the superficial layer and the second column to the deep layer. Linear regression lines are shown as dashed lines. Blue points and lines correspond to controls; red points and lines correspond to diabetic patients. Pearson correlation coefficients for the controls and diabetic patients are listed in blue and red text, respectively.
