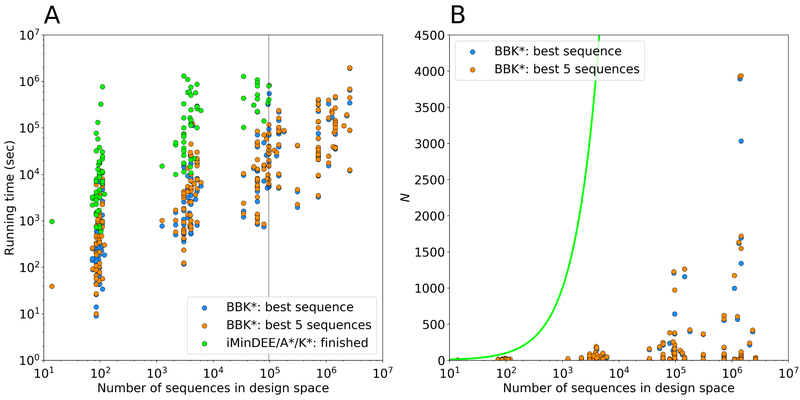
Figure 8: Measuring the contributions of the BBK*36 algorithmic improvements to the empirically observed running times of osprey.
BBK* calculations were run to predict either the single top sequence or to enumerate the top 5, and were compared to exhaustive computation of K* scores for each sequence (i.e., iMinDEE/A*/K*2,16 or single-sequence K*), which was the prior state of the art for Boltzmann-weighted ensemble-based binding affinity computation before BBK*. (A) Running times for BBK* and single-sequence K* vs. the number of sequences in the search space for 204 protein design test cases, a benchmark set described in Ref. 36. Single-sequence K* completed only 107 of the test cases within a 30-day time limit (left of the vertical line), and took up to 800 times longer than BBK* to do so, while BBK* completed all the designs within the time limit. (B) The number N of sequences whose energies must be examined or bounded by iMinDEE/A*/K* (green line; exponential in the number of mutable residue positions) and by BBK* (dots). For each data point representing a BBK* test case, the vertical gap between that data point and the green line (gap on the y axis) represents the number of sequences that are pruned without ever having to be examined. Figure adapted with permission from Ref. 36.

