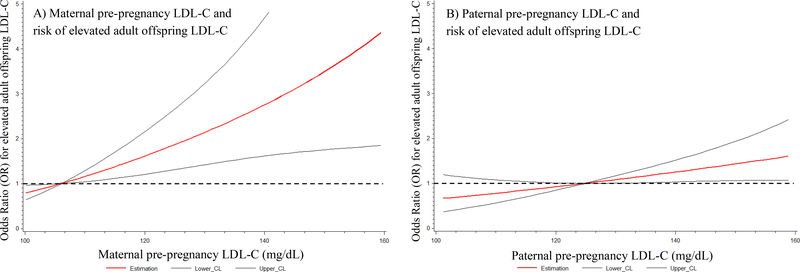
Figure 3:
Odds ratio (OR) for elevated adult offspring LDL-C (red line) and 95% CI (black lines) across a range of maternal (A) and paternal (B) pre-pregnancy LDL-C levels estimated with penalized restricted cubic splines in fully adjusted models for anthropometric, lifestyle and genetic factors (model 4). Dashed line depicts no elevated risk (OR = 1).

