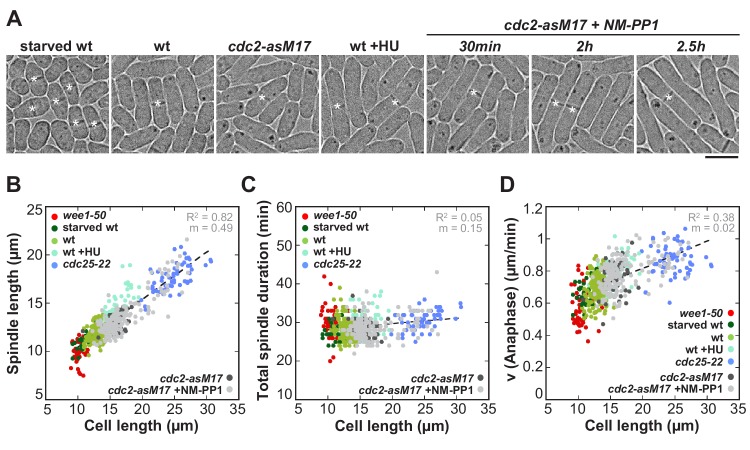
Figure 2. Spindle length and spindle elongation velocity scales with cell length in multiple conditions.
(A) Brightfield images of S. pombe wild-type cells in starvation (starved wt), wild-type cells in exponential growth phase (wt), cdc2-asM17 cells, wild-type cells treated with hydroxyurea (wt+HU), cdc2-asM17 cells treated with NM-PP1 for 30 min, 2 hr or 2.5 hr. Cells reach their maximum cell length at mitosis/cell division, represented by the septum (asterisk). Scale bar, 5 µm. (B) Final spindle length plotted against cell length. (C) Total spindle duration plotted against cell length. (D) Anaphase spindle elongation velocity plotted against cell length. Data in (B–D) was fitted by linear regression (dashed lines), showing the regression coefficient R2 and the slope m. Data was obtained from n cells (starved wt: n = 27, wt: n = 133, wt +HU: n = 52, cdc2-asM17: n = 49, cdc2-asM17 + NM-PP1: n = 163) was collected from three independent experiments.

