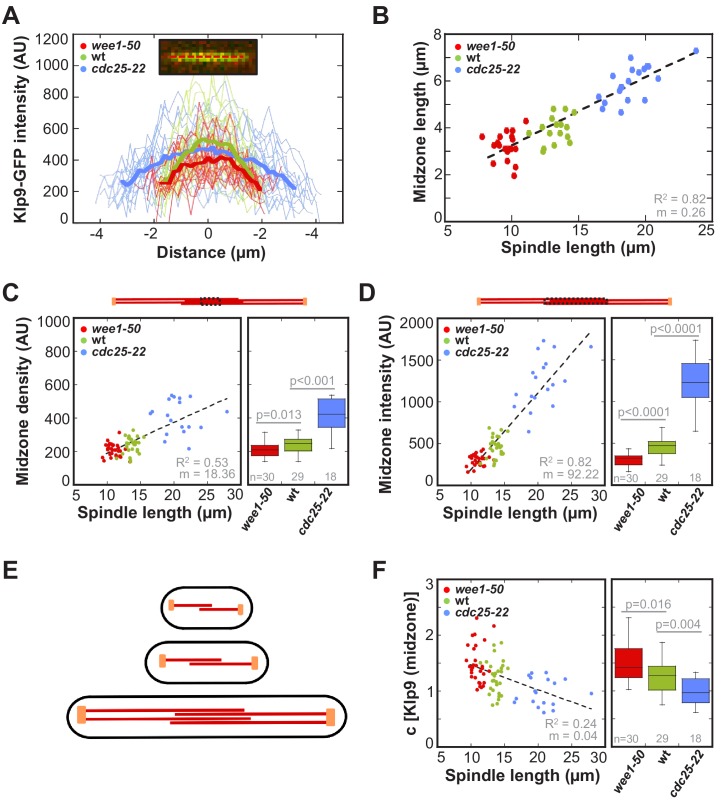
Figure 7. Longer spindles provide overproportionally more binding sites for Klp9.
(A) Intensities obtained by line scan analysis of Klp9-GFP signals at anaphase spindles of wee1-50 (n = 20), wild-type (n = 20) and cdc25-22 (n = 20) cells. A line was placed over the whole length of the Klp9-GFP signal (red dashed line, inset) and the resulting intensity spectrum is shown. Bold curves correspond to the mean intensity distribution for each cell type. (B) Mean midzone length plotted against spindle length (wee1-50: n = 19, wt: n = 16, cdc25-22: n = 19). (C) mCherry-Atb2 density of the midzone, measured as illustrated by the dashed box within the scheme illustrating the mitotic spindle, plotted against final spindle length (left panel) and box plot comparison of the mCherry-Atb2 density of the midzone (right panel). (D) Total mCherry-Atb2 intensity of the midzone, measured as illustrated by the dashed box within the scheme illustrating the mitotic spindle, plotted against final spindle length (left panel) and box plot comparison of the total mCherry-Atb2 intensity of the midzone (right panel). (E) Model for mitotic spindle structure in fission yeast cells of different sizes. MTs are shown in red and spindle poles in orange. (F) Effective concentration of Klp9 at the midzone plotted against spindle length (left panel) and box plot comparison of the effective concentration of Klp9 at the midzone (right panel). Data in (B–D) and (F) was fitted by linear regression (dashed lines), showing the regression coefficient R2 and the slope m. P values were calculated by Mann-Whitney U test. Data obtained from n analyzed cells was collected from three independent experiments.
Figure 7—figure supplement 1. Measurement of midzone length.
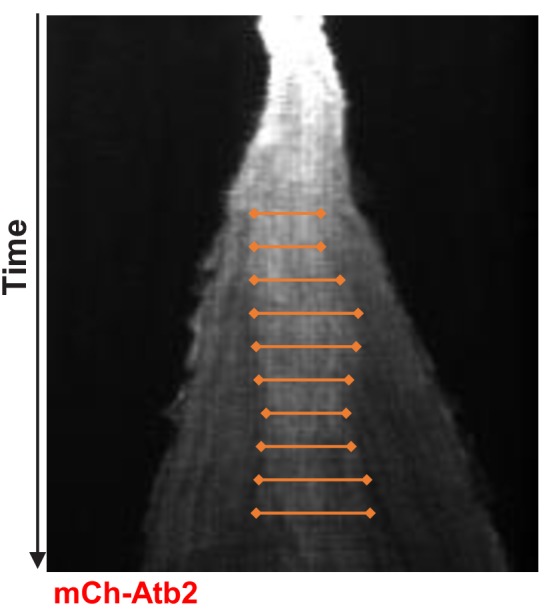
Figure 7—figure supplement 2. Midzone length throughout progressing spindle elongation in anaphase plotted against time.
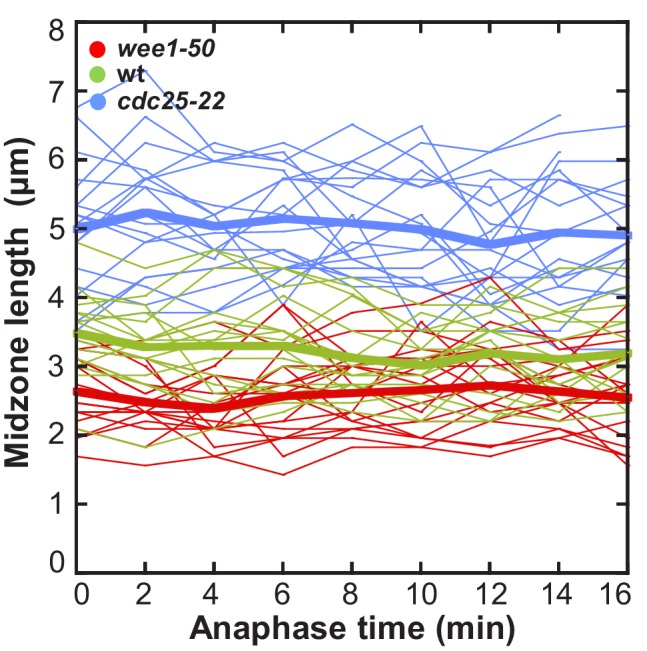
Figure 7—figure supplement 3. Ratio of mCherry-Atb2 intensity of the anaphase spindle and spindle length plotted against cell length.
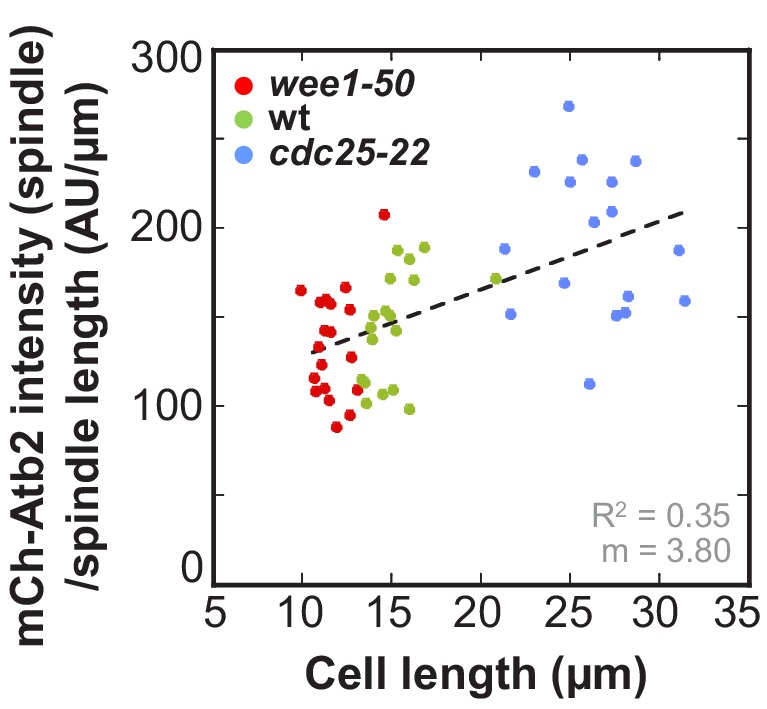
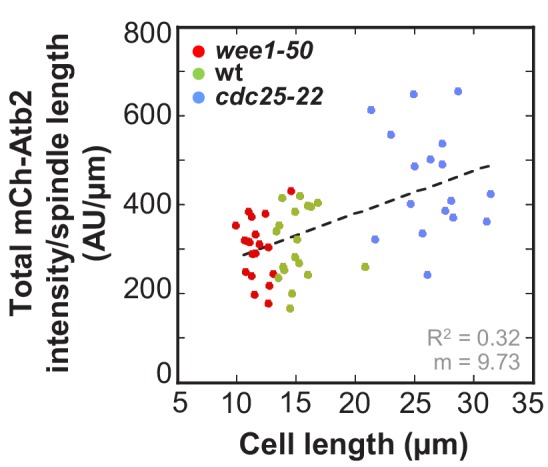
Figure 7—figure supplement 4. Ratio of total mCherry-Atb2 intensity and spindle length plotted against cell length.
