. 2019 Feb 4;8:e42101. doi: 10.7554/eLife.42101

Figure 2. Dependence of LFP power spectra and MU firing activity on surface size.

(A) Illustration of experimental paradigm (Dataset 2, see Materials and methods; n = 9 sessions, 59.75±0.09/25.64±0.12 trials chromatic vs achromatic trials per condition in each session). Uniform surfaces of four different sizes were presented on a gray background screen. Fixation spot is enlarged for visibility. Right: Receptive field estimated with bar stimuli for a representative target channel, with the outline (orange dashed line) of the largest size stimulus (see Materials and methods). Note that the activation outside the RF is due to the use of large bar stimuli sweeping over the monitor. (B) LFP power spectra for different sizes and chromatic/achromatic conditions. LFP power spectrum estimated and normalized as in Figure 1C, but now using 300 ms epochs. Right panel shows the gamma-band amplitude as a function of size, estimated using a polynomial fitting procedure between 30 and 80 Hz (see Materials and methods). The difference between 6 and 0.5 deg stimuli was significantly larger for chromatic than achromatic condition (P<0.05, bootstrap test, see Materials and methods). (C) Modulation of firing rate relative to baseline, expressed as log10(stim/base), for different sizes and chromatic/achromatic conditions. Right panel shows surround suppression, which was defined as the difference in firing rate modulation between the 0.5 degree size and the other sizes.

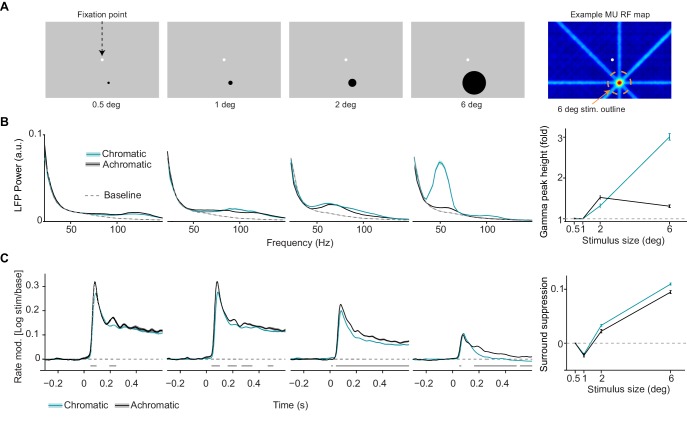
Figure 2.

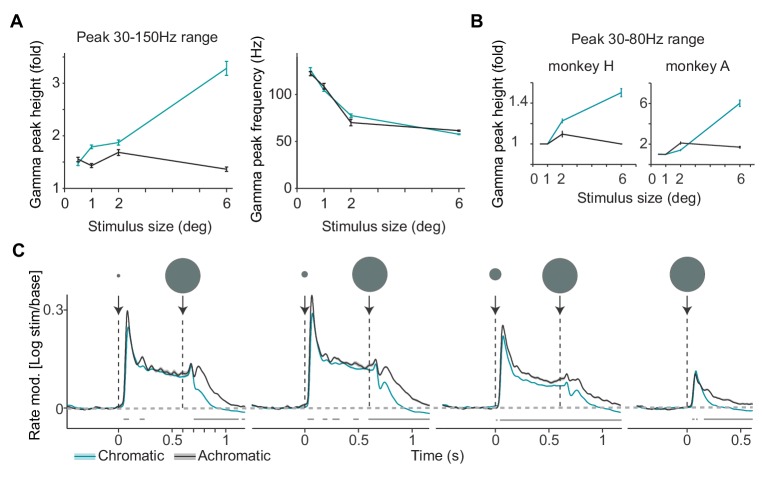
Figure 2—figure supplement 1. Analysis of LFP and multi-unit activity in response to stimuli of varying size.

Figure 2—figure supplement 1.

(A) Gamma-band peak amplitude and peak-frequency as a function of size, estimated using a polynomial fitting procedure between 30 and 150 Hz. A wider range instead of the standard 30–80 Hz range was used here, to also capture peaks >100 Hz, which is far outside the typical range of classical visual gamma range. This activity may reflect spike bleed-through, which is beyond the scope of the present study. (B) Average gamma-band peak height in 30–80 Hz range, shown separately for the two monkeys. This figure panel corresponds to Figure 2B of the main text. The difference between 6 and 0.5 deg stimuli was significantly larger for the chromatic than achromatic condition for both animals (p<0.05, bootstrap test). (C) Each trial contained a sequence of two stimuli, either the small stimulus first for 600 ms, or the large stimulus first for 600 ms (see Materials and methods). Here we show the first type of sequence to illustrate the onset of a surround when the stimulus covering the classical RF is already present. Modulation of firing rate relative to baseline, expressed as log10 (stim/base), for different sizes and chromatic/achromatic conditions. Note rapid firing suppression after onset of the large stimulus following the 0.5 deg stimulus, with a significant difference arising already after 100 ms.