. 2019 Feb 4;8:e42692. doi: 10.7554/eLife.42692

Figure 4. Spatial and temporal characterization of DIP-α expression.

(A) T1 LinA/15 leg MN MARCM clones using OK371-Gal4 > 20XUAS-6XmCherry (magenta) and DIP-α-T2A-QF > 10XQUAS-6XGFP (green) to label leg MN cell bodies in the VNC at multiple developmental time points. At late L3 stages DIP-α expression is not yet ‘ON’ in LinA/15 leg MNs although expression is observed in non-LinA/15 cells (asterisk). Between 10–25 hr APF, the three LinA/15 α-leg MNs (Figure 4—figure supplement 1A) initiate DIP-α expression in a sequential manner, one after the other (arrowheads point to DIP-α+cells in LinA/15 clones) (scale bar: 10 μm). (B) Pupal leg at 25 hr APF stained for all MNs (OK371-Gal4 > 20XUAS-6XmCherry; magenta), immature muscles (Mef2 expression; grey), and DIP-α-expressing MNs (green). (scale bar: 25 μm). (C) Endogenous DIP-α expression in αTi-ltm and αTi-tadm axon termini using GFP-tagged DIP-α-GFSTF (green, detected by anti-GFP, see Materials and methods) and labeled by DIP-α-T2A-QF > 10XQUAS-6XmCherry magenta) at 35 hr APF, 45 hr APF and in 1 week old adults. White arrowheads point to selected regions of mCherry and GFP co-expression. White-dotted boxes denote magnified insets in Figure 4—figure supplement 1D. (scale bar: 25 μm) (D) Temporal rescue at 125 hr APF of axon terminal branching of αFe-ltm in the proximal Fe of T1 adult legs in samples mutant for DIP-α using DIP-α-T2A-Gal4 > 20X-6XGFP, UAS-DIP-α-V5 and tub-Gal80ts (see Supplementary File 2). Top row: Negative control (no UAS-DIP-α-V5) showing absence of αFe-ltm terminal branching in flies that were temperature shifted from 18°C to 30°C at 125 hr APF (axons, white; cuticle, grey). Middle row: Positive control (no tub-Gal80ts) showing complete terminal branching of αFe-ltm in flies that were temperature shifted from 18°C to 30°C at 125 hr APF (axons, green; cuticle, grey). Bottom row: Temporal rescue of terminal branching of αFe-ltm in a DIP-α mutant background in flies that were temperature shifted from 18°C to 30°C at 125 hr APF; Terminal branches are shorter and/or fewer in number compared to the positive controls (axons, green; cuticle, grey). (E) Quantification of T1 leg samples with terminal branching of αFe-ltm in temporally rescued samples (N = 8) (green circles) compared to positive controls (N = 4–6) (no tub-Gal80ts, dark green squares) that were temperature-shifted together at 75 hr, 100 hr or 125 hr APF. Terminal branching of αFe-ltm was seen in 87.5% of samples that were temperature-shifted at 75 hr APF and in 71.42% of samples that were temperature-shifted at 100 hr or 125 hr APF. Terminal branching was always observed in 100% of samples of the positive control and always absent in the negative control (N = 4–6, Figure 4C). Stages of leg MN axon development are indicated below the graph as defined in Figure 1. Initiation of endogenous DIP-α expression in the three WT LinA/15 α-leg MNs is indicated by a vertical green bar at 10 to 25 hr APF. Time of eclosion is indicated by a vertical line at 120 hr/5 days APF.

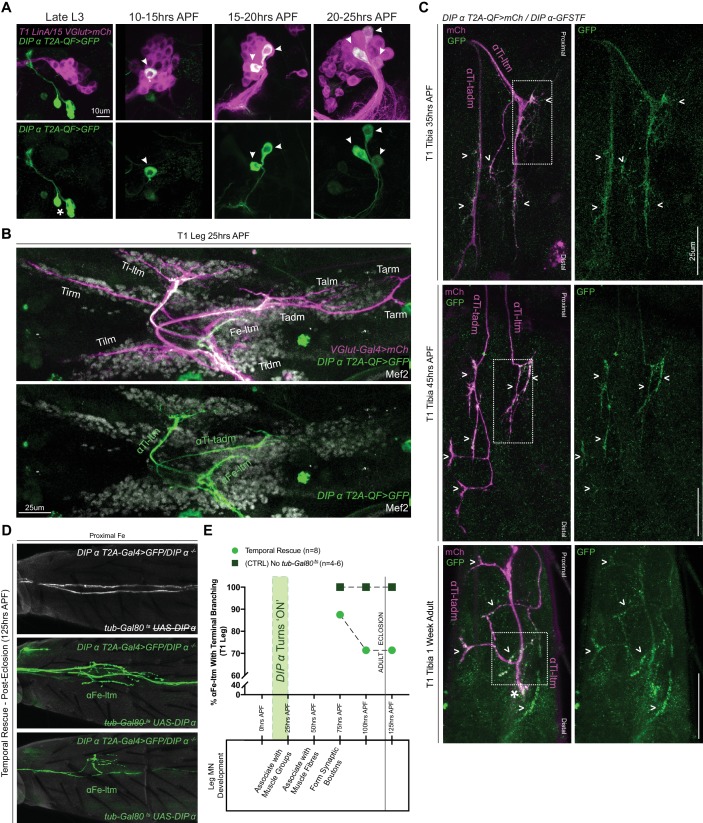
Figure 4.

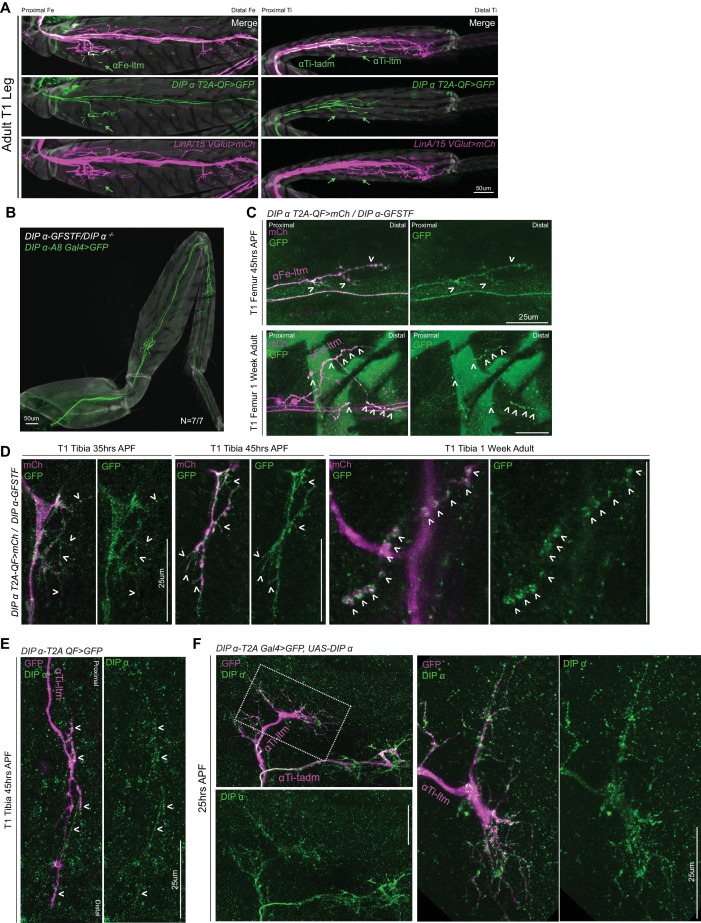
Figure 4—figure supplement 1. Spatial and temporal characterisation of DIP-α expression.

Figure 4—figure supplement 1.

(A) T1 LinA/15 leg MN cis2MARCM clones (Enriquez et al., 2018) using OK371-Gal4 > 20XUAS-6XmCherry (magenta) and DIP-α-T2A-QF > 10XQUAS-6XGFP (green) to label leg MN axons in the T1 adult Fe and Ti leg segments. Green arrows indicate terminal branching of αFe-ltm, αTi-ltm, and αTi-tadm as belonging to the LinA/15 leg MN lineage in Fe and Ti segments respectively. (scale bar: 50 μm) (B) T1 α-leg MNs labeled by DIP-α-A8-Gal4 > 20XUAS-6XGFP (green) showing normal terminal branching in DIP-α-GFSTF/DIP-α animals (N = 7/7). (cuticle, grey). (scale bar: 50 μm) (C) Endogenous DIP-α expression in P-D oriented αFe-ltm axon terminals using GFP-tagged DIP-α-GFSTF (green, detected by anti-GFP – see Materials and methods) and labeled by DIP-α-T2A-QF > 10XQUAS-6XmCherry (magenta) at 45 hr APF and in 1 week adults. White arrowheads point to selected regions of mCherry and GFP co-expression. (scale bar: 25 μm). (D) Magnified insets from Figure 4C showing localization of DIP-α::GFP protein expression using DIP-α-GFSTF (green, detected by anti-GFP; see Materials and methods) in fine filopodial projections of αTi-ltm and αTi-tadm labeled by DIP-α-T2A-QF > 10XQUAS-6XmCherry (magenta) at 35 hr and 45 hr APF, and in pre-synaptic regions of the NMJ/synaptic boutons along the terminal branches in 1 week old adults (denoted by white arrowheads) (scale bar: 25 μm). (E) Antibody staining against DIP-α (green) in an αTi-ltm axon labeled by DIP-α-T2A-QF > 10XQUAS-6XGFP (magenta) at 45 hr APF showing low levels of expression in specific axon branches (denoted by white arrowheads). (scale bar: 25 μm). (F) Antibody staining against DIP-α (green) in α-leg MN axons (Left) overexpressing DIP-α and labeled by DIP-α-T2A-Gal4 > 20XUAS-6XGFP, UAS-DIP-α (magenta) at 25 hr APF showing high levels of expression in axon terminals including filopodial projections. White-dotted box denotes magnified inset of αTi-ltm (right) (scale bar: 25 μm).
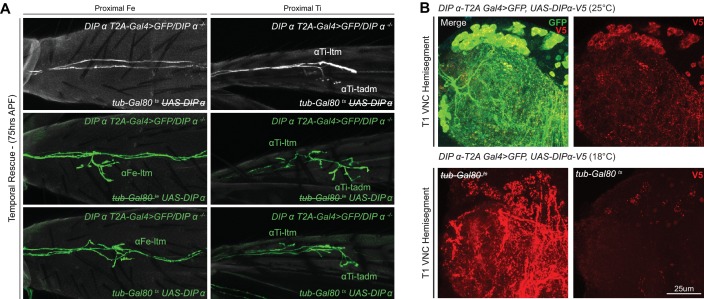
Figure 4—figure supplement 2. Temporal rescue of DIP-α in a mutant background.

Figure 4—figure supplement 2.

(A) Temporal rescue at 75 hr APF of axon terminal branching of αFe-ltm (left column) and αTi-ltm (right column) in the proximal Fe of T1 adult legs in samples mutant for DIP-α using DIP-α-T2A-Gal4 > 20XUAS-6XGFP, UAS-DIP-α-V5 and tub-Gal80ts (see Materials and methods). Top row: Negative control (no UAS-DIP-α-V5) showing absence of αFe-ltm and αTi-ltm terminal branching in flies that were temperature shifted from 18°C to 30°C at 75 hr APF (axons, white; cuticle, grey). Middle row: Positive control (no tub-Gal80ts) showing complete terminal branching of αFe-ltm but incomplete terminal branching of αTi-ltm and αTi-tadm in flies that were temperature shifted from 18°C to 30°C at 75 hr APF (refer to Figure 3. for WT terminal branching) (axons, green; cuticle, grey). Bottom row: Temporal rescue of terminal branching of αFe-ltm in a DIP-α mutant background in flies that were temperature shifted from 18°C to 30°C at 75 hr APF; αTi-ltm and αTi-tadm were not compared to defective positive controls. (axons, green; cuticle, grey). (B) T1 VNC hemisegments expressing DIP-α-T2A-Gal4 > 20XUAS-6XGFP, UAS-DIP-α-V5 at 25°C (top) and with/without tub-Gal80ts at 18°C (bottom) stained for V5 expression (red). (scale bar: 25 μm).