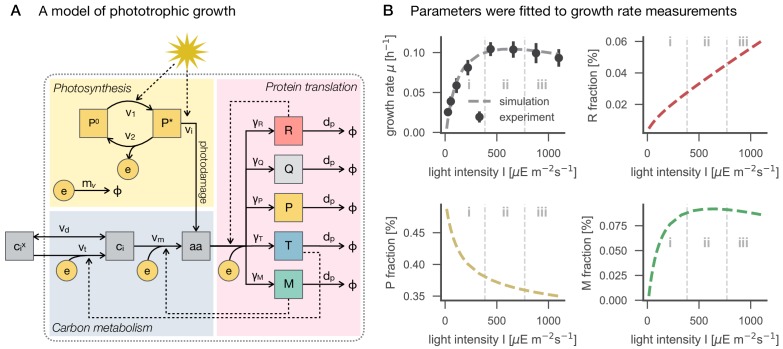
Figure 5. A model of phototrophic growth and reproduction of experimental growth curves.
Panel A: A coarse-grained model of phototrophic growth, adopted from Faizi et al. (2018). The model describes optimal proteome allocation under conditions of (i) light-limited, (ii) light-saturated and (iii) light-inhibited growth. Coarse-grained cellular processes include passive () and active import () of external inorganic carbon , conversion of inorganic carbon into amino acids (), light harvesting and provision of cellular energy by photosynthesis ( and ), as well as maintenance and photodamage ( and ). Amino acids are translated into coarse-grained protein fractions for transport (), metabolism (), ribosomes (), photosynthetic electron transport (), as well as a growth-independent proteome fraction . Translation is limited by the amount of available ribosomes . Panel B: The model reproduces the measured growth curve (Figure 1C–D) as a function of light intensity. Shown are the specific growth rate μ, as well as the main proteome fractions predicted by the model: ribosome () fraction, photosynthetic electron transport () fraction, and metabolism () fraction, as a function of light intensity.

