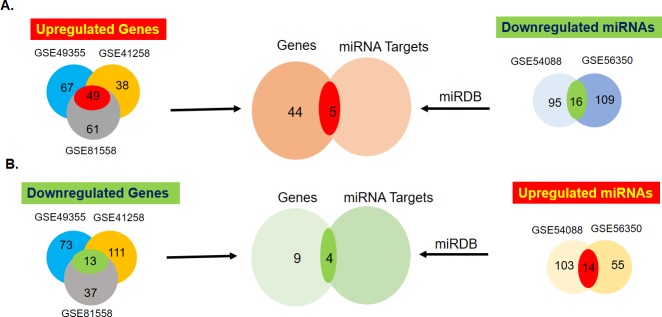
Fig 1. Representative diagrams of identification of microRNAs (miRNAs) and their targets between primary colorectal tissues and their hepatic (liver) metastases.
The Venn diagrams demonstrate the number of common differentially expressed genes (DEGs), miRNAs and the miRNA targets (red = upregulated and green = downregulated) from different Gene Expression Omnibus (GEO) datasets.

