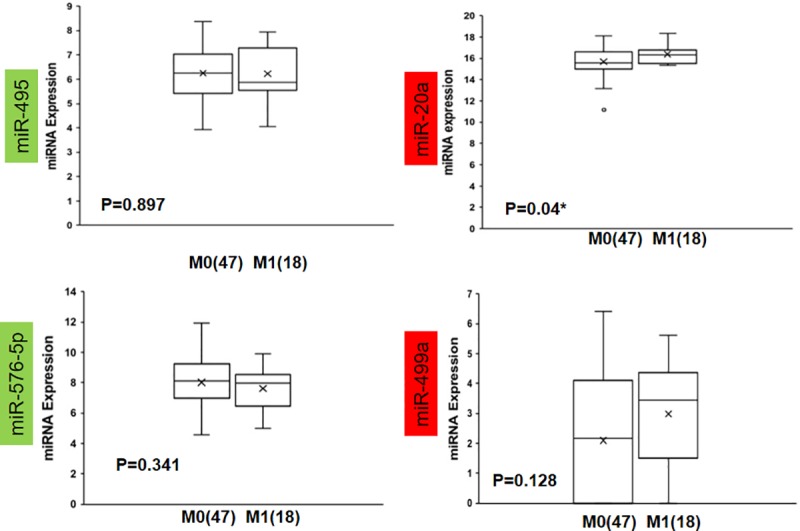
Fig 2. Expression patterns in GSE29623 of common miRNAs with targets from the DEGs.

The miRNAs with a green background are commonly downregulated from Fig 1, and those with a red background are upregulated. The * represents Mann-Whitney U p-value<0.05, M0 = TNM stage I, II, III or no distant metastases and M1 = TNM stage IV or distance metastases; the number in brackets represents the case number. Note: miRNA-619 and miRNA-382 were not expressed in this dataset.
