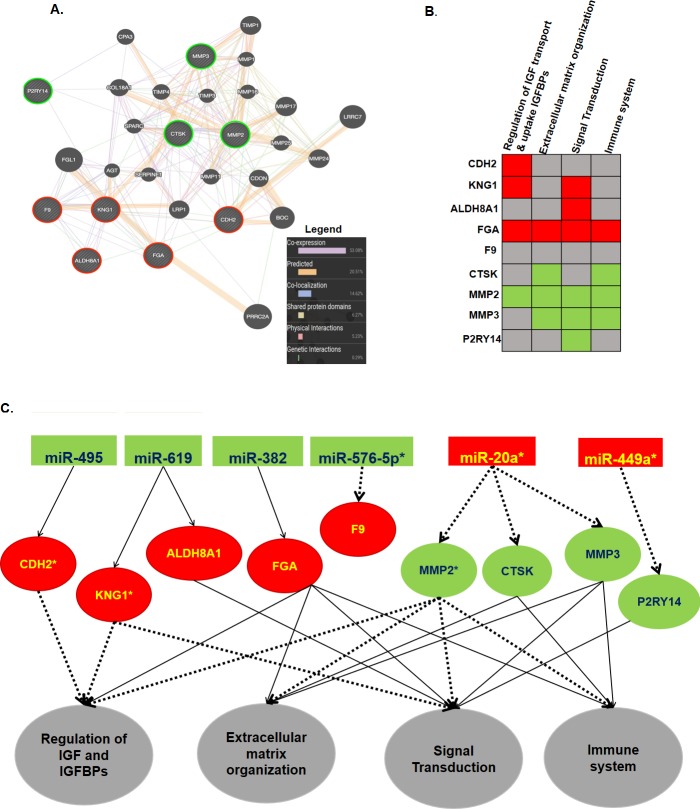
Fig 8.
Gene interaction network (A) and pathway enrichment summary of the common miRNA targets. For Figure (A), the input genes are indicated with stripes, and the green circles represent downregulated and red represents upregulated genes in CRC liver metastases, while for (B), green indicates downregulation, red indicates upregulation and gray indicates that the gene was not enriched in that pathway. The pathways are in order of their enrichment value from left to right (genes≥4, FDR<0.05, p-value<0.05). (C) Schematic summary showing possible interactions of the miRNAs and their targets in their respective pathways. Red background represents upregulation and green background indicates downregulation in CRC liver metastasis, * represents significant expression in the respective validation dataset, thick dashed black lines represent significant interactions and thin black lines represent a nonsignificant interaction. The respective pathways are represented by a gray background.

