. 2019 Feb 26;8:e40162. doi: 10.7554/eLife.40162

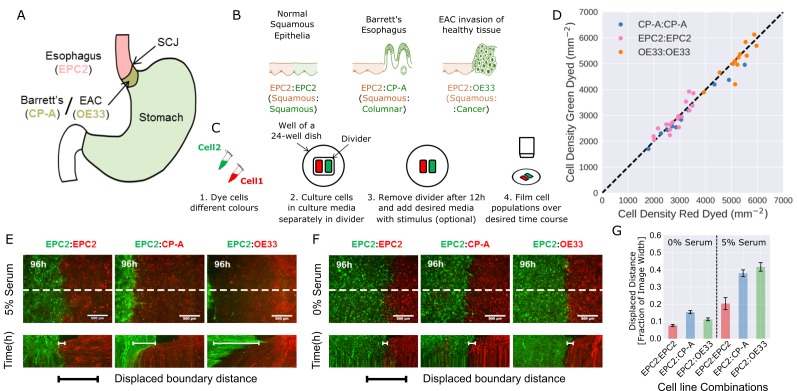
Figure 1. Temporary divider system to study interactions between cell populations.

(A) The squamous-columnar junction (SCJ) divides the stratified squamous epithelia of the esophagus and the columnar epithelia of the stomach. Barrett’s esophagus (BE) is characterised by squamous epithelia being replaced by columnar epithelial cells. The three cell lines derived from the indicated locations were used in the assays (EPC2, squamous esophagus epithelium, CP-A, Barrett’s esophagus and OE33, esophageal adenocarcinoma (EAC) cell line). (B) The three main epithelial interfaces that occur in BE to EAC progression. (C) Overview of the experimental procedure, described in steps 1–3. In our assay, cells were allowed to migrate and were filmed for 4–6 days after removal of the divider (step 4). (D) Cell density of red- vs green-dyed cells in the same culture, automatically counted from confocal images taken of fixed samples at 0, 1, 2, 3, and 4 days and co-plotted on the same axes. Each point is derived from a separate image. If a point lies on the identity line (black dashed), within the image, red- and green-dyed cells have the same cell density. (E,F) Top images: Snapshot at 96 h of three combinations of epithelial cell types, cultured in 0% or 5% serum as indicated. Bottom images: kymographs cut through the mid-height of the videos as marked by the dashed white line. All scale bars: 500 μm. (G) Displaced distance of the boundary following gap closure in (E,F) normalised by the image width. From left to right, n = 16, 16, 16, 17, 30, 17 videos.

Figure 1.

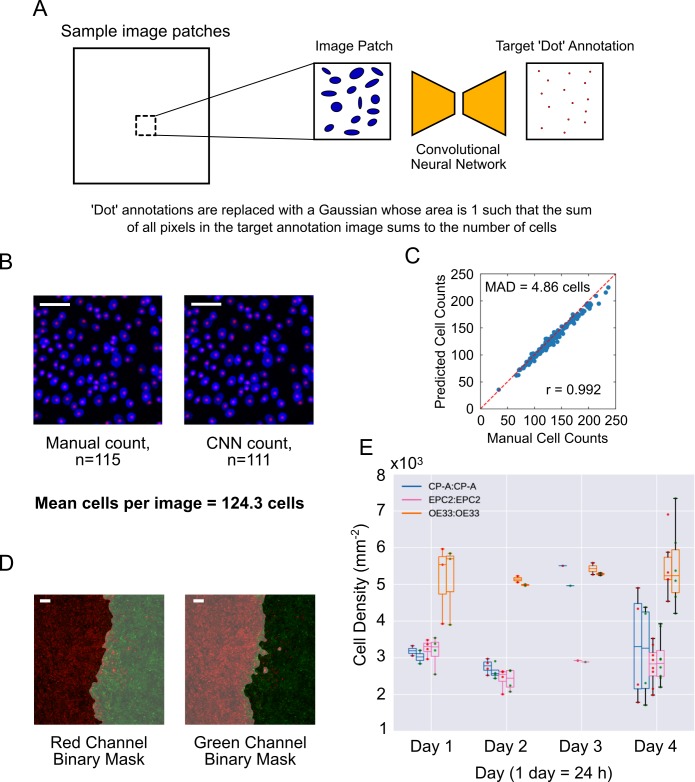
Figure 1—figure supplement 1. Automated cell counting with convolutional neural networks (CNN).

Figure 1—figure supplement 1.

(A) CNN training procedure. Image patches (64 × 64 pixels) are randomly subsampled from the large DAPI-stained images. The convolutional network is trained to transform a given DAPI image patch to a dot-like image such that the sum of all pixel intensities in the output dot-like image equals the number of cells in the DAPI image. During training, the ideal dot-like image is provided by manual annotation. (B) An example of a 64 × 64 pixels image patch of cells stained with DAPI (blue), with individual cells counted manually (left) or by automatic CNN counting (right). Red spots mark individual counted cells. (C) Plot of manually annotated cell counts vs automated cell counts tested on 64 × 64 image patches (n = 200). Each point is a patch. The mean absolute deviation (MAD) was 4.86 cells, a percentage error of 3.91% for an average of 124.3 cells per image. Pearson correlation coefficient, r = 0.992. Red dashed line is the ideal identity line. (D) Image segmentation of epithelial sheets coloured with red and green dyes, used for sheet-specific cell counting. Grey shaded area is the excluded image area. (E) Paired boxplots of cell density (number of cells/sheet area, plotted as x103 on y-axis) for each monolayer from fixed samples collected at different times (up to 4 days (96 h) after divider removal). In each pair, the left boxplot is for the red labelled cells and right for the green labelled cells, indicated by red or green dots, respectively. Each dot represents the value from a confocal image. Outline box colour indicates the cell line (see legend). All scale bars: 200 μm.
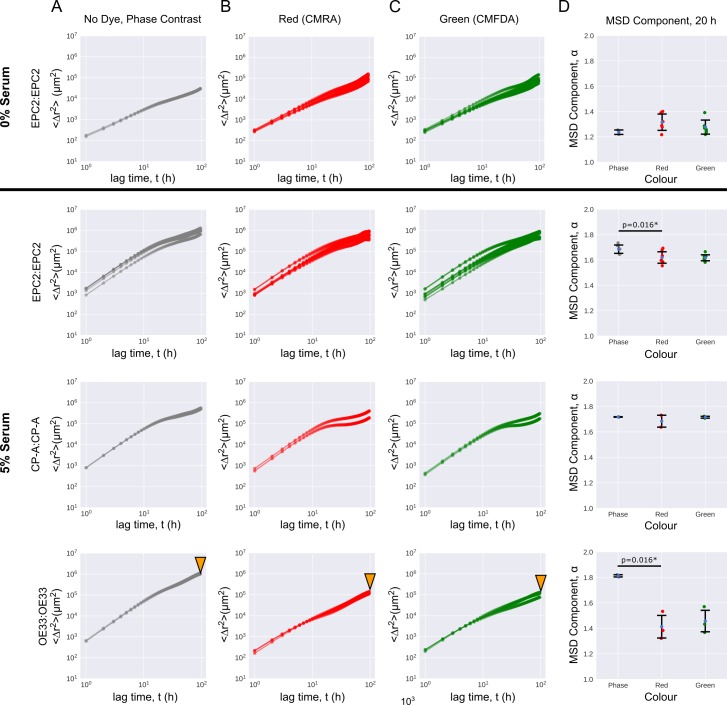
Figure 1—figure supplement 2. Cell migration is largely unaffected by dye colour.

Figure 1—figure supplement 2.

Mean squared displacement (MSD) curves computed from optical flow plotted on a log10-log10 axis as a function of the time interval for named same cell line combinations in 0% and 5% serum. (A–C) MSD curves coloured grey for phase-constrast non-dyed (A), red for red-dyed (B) and green for green-dyed cells (C). (D) Errorbar plots showing mean extracted exponent α from MSD = Δtα (Materials and methods) ± one standard deviation for time intervals 0Δt20 h, for the phase-contrast, red and green sheets of individual phase-contrast plus RGB channel videos. Each point is a video. Two sided t-test was applied assuming identical variances. * denotes p = < 0.05. Red and green lipophilic dye reduced the mobility of non-dyed EPC2 and OE33 cells with statistical significance. The size effect was particularly large in OE33, (bottom row marked with orange triangles) with a large drop in the MSD exponent. We do not know the cause but it may be a result of the dyes affecting each cell line differently.
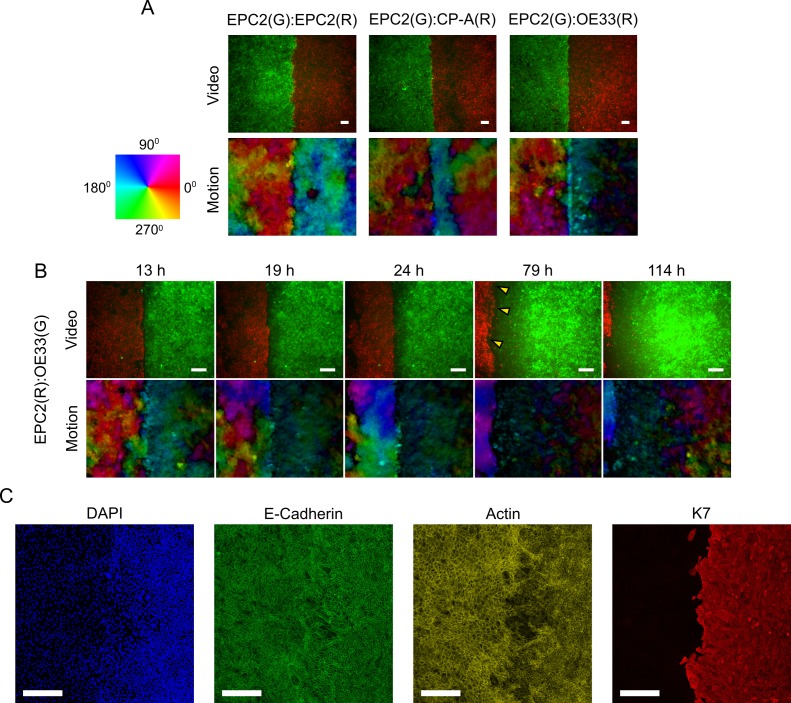
Figure 1—figure supplement 3. Motion fields at gap closure between EPC2:EPC2, EPC2:CP-A and EPC2:OE33 cell line combinations.

Figure 1—figure supplement 3.

(A) Snapshot of the combined motion field of red (R) and green (G) dyed cells at the frame of gap closure (16 h, 14 h and 12 h for EPC2:EPC2, EPC2:CP-A, EPC2:OE33 respectively) coloured by direction of movement according to the colour wheel for representative videos. (B) Snapshots of the EPC2:OE33 motion field taken at different times following gap closure. Yellow triangles indicate identified motion in ‘green’ cells where the dye fluorescence is nearly lost. (C) Confocal staining of a fixed EPC2:OE33 sample at 72 h. DAPI stains the DNA; E-cadherin marks the adherens junctions; actin (β-actin) marks the actin-cytoskeleton; and K7 (Keratin 7) marks the OE33 cells of columnar epithelium origin. All scale bars: 200 μm.
Figure 1—figure supplement 4. Gap closure times and cell proliferation of cell line combinations in 0% and 5% serum.

Figure 1—figure supplement 4.

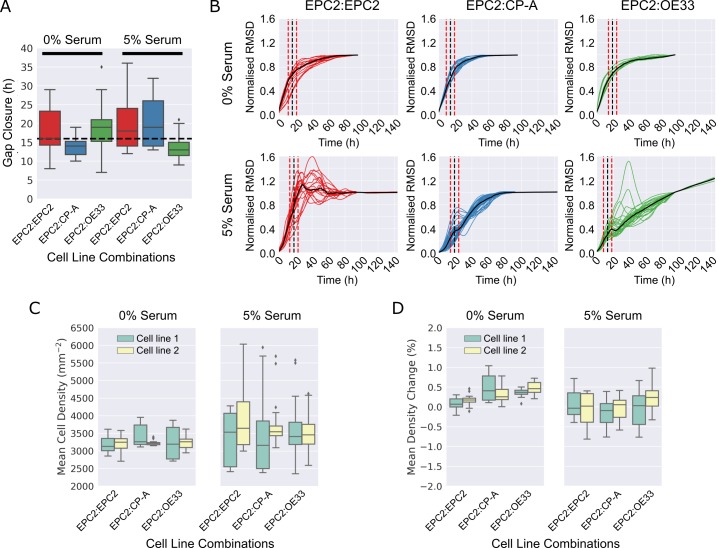
(A). Boxplots showing median and interquartile range (IQR) of gap closure in EPC2:EPC2, EPC2:CP-A and EPC2:OE33 combinations. Whiskers indicate data within 1.5 x IQR of lower and upper quartiles. Black dashed line = global mean gap closure time. (B) Root mean squared displacement (RMSD) curves of x-direction velocity components in 0% and 5% serum conditions with mean gap closure point marked (black dashed line) with ± 5 h either side (red dashed lines), the accuracy to which we could detect the gap closure frame (Figure 3—figure supplement 9). (C,D) Grouped boxplots of mean cell density (C) and cell density change (D) from automatic cell counting using convolutional neural networks. Cell line combinations are written cell line 1:cell line 2 thus EPC2:CP-A indicates cell line 1 = EPC2, cell line 2 = CP-A. Cell line 1 and cell line 2 are coloured green and yellow in the boxplots, respectively.
Figure 1—figure supplement 5. Collective sheet migration dynamics are lost in 0% serum.

Figure 1—figure supplement 5.

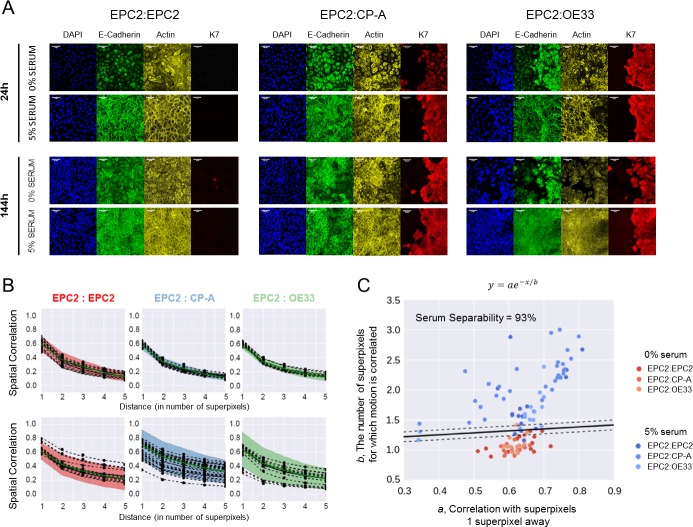
(A) Samples grown in 0% or 5% serum were fixed for staining at 24 h when the gap between the two sheets have just closed, and at 144 h at the end of filming. DAPI (blue) marks the cell nucleus. E-cadherin (green) marks the adherens junctions. Actin (β-actin, yellow) marks the actin-cytoskeleton. K7 (Keratin 7, red) is a specific marker of columnar cells. All scale bars: 20 μm. (B) Spatial correlation curves computed from superpixel tracks as a function of superpixel distance (Materials and methods). Black dots = computed values. Dashed black line = fitted line to black dots of the form, y=ae-x/b. Green solid line = median line computed from the black dots. Shaded region = ± 2 standard deviations of the green median line. (C) Plot of the extracted values a vs b, where a is the correlation with superpixels 1 superpixel away and b the characteristic number of superpixels away for which motion is correlated. Each video is a point, see legend for colour code. The higher points are on the plot, the greater the collective motion. Black solid line is the support vector of a linear support vector machine (SVM) trained to separate 0% and 5% serum according to the values of a and b. Dashed black lines mark the SVM margin. Serum separability, the ability to predict if a video contains 0% or 5% serum, is defined as the training SVM accuracy using the whole dataset, n = 112 videos (n = 16 each for EPC2:EPC2, EPC2:CP-A, EPC2:OE33 in 0% serum and n = 17 EPC2:EPC2, 30 EPC2:CP-A and 17 EPC2:EPC2 in 5% serum).