
Figure 4. MD simulations - binding in the fenestrations prevents fenestration gating.
(a) Side view on a TWIK-1 based TASK-1 homology model with bupivacaine located in the side fenestrations after 100 ns MD simulations. (b–c) Zoom-ins illustrating 'hit' residues of the alanine scan, which were confirmed in the MD simulations to have contacts with bupivacaine. (d) TASK-1 homology model based on TWIK-1 depicting bupivacaine within the two side fenestrations. (e) Hole analysis before (light gray) and after (gray) 100 ns MD simulations revealing a collapse of the side fenestrations when the channels move to the 'up' state. (f) Hole analysis as in (e), but in the presence of bupivacaine (purple), which prevents the movement to the 'up' state and the concomitant collapse of the fenestrations. (g) TASK-1 homology model in the absence of bupivacaine before (gray) and after 100 ns of MD simulations (black). Green arrows indicate the movement of the M2, M3 and M4 segments causing the 'down' to 'up' transition. (h) TASK-1 homology model in the presence of bupivacaine (green) before (gray) and after (purple) 100 ns, illustrating the lack of the M2, M3 and M4 movements. (i) Root-mean-square fluctuations (RMSF) calculated for the alpha carbons of the M2, M3, P2 and M4 segments in the absence and presence of bupivacaine. (j) Quantitative analysis of the bottleneck radius of the side fenestrations over the time course of 100 ns MD simulations (n = 4) in the absence (gray) and presence (purple) of bupivacaine. Data are represented as mean ± S.E.M.

Figure 4—figure supplement 1. Reduced bupivacaine inhibition by M3 mutants.
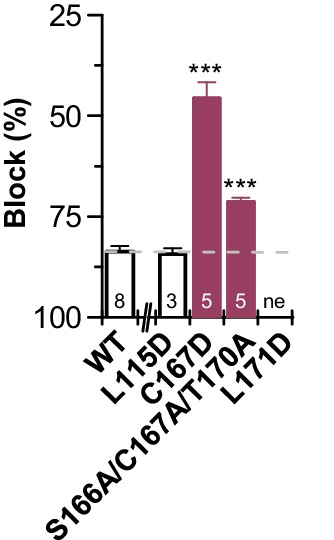
Figure 4—figure supplement 2. Induced fit docking experiments predict a bupivacaine binding mode highly similar to that of classical docking experiments.

Figure 4—figure supplement 3. MD simulations - binding in the fenestrations prevents fenestration gating.
