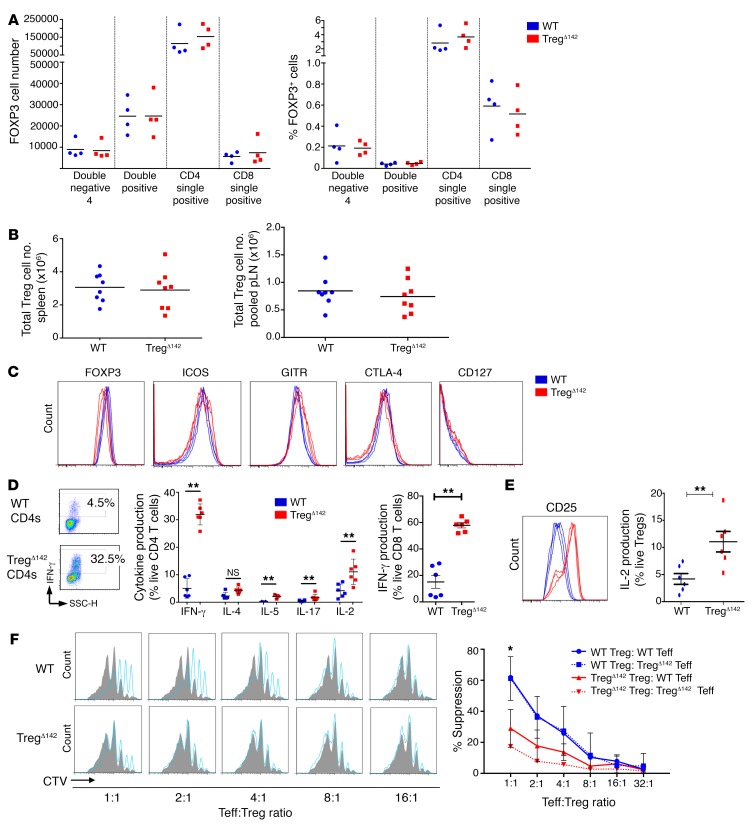
Figure 2. MiR-142–deficient Tregs develop normally, but fail to suppress Teff responses in vitro.
(A) Number and proportion (%) of FOXP3+ (CD4+YFP+) cells at successive stages of thymus development (n = 4 per group). (B) Number of FOXP3+ cells in spleen (left) and peripheral lymph node (pLN) (right) samples (n = 8). (C) Flow cytometry histograms of peripheral Tregs (CD4+CD25+FOXP3+) stained for surface and intracellular Treg markers (n ≥ 4 per group). (D) Flow cytometry and cytokine secretion profiles of CD3+CD4+ and CD3+CD8+ T cells. **P < 0.01, 2-tailed Student’s t test. n ≥ 4 per group. (E) Flow cytometry and intracytoplasmic cytokine capture data for CD25 surface expression and IL-2 production in TregΔ142 (CD4+YFP+) versus WT Tregs (CD4+CD25+FOXP3+). **P < 0.01, 2-tailed Student’s t test. n = 6 per group. (F) Coculture suppression assays; P value represents comparison of WT Tregs, WT Teffs, and TregΔ142 WT Teffs (data combined from 3 independent experiments). CTV, CellTrace Violet. *P < 0.05, 2-tailed Student’s t test. n > 3 per group.

