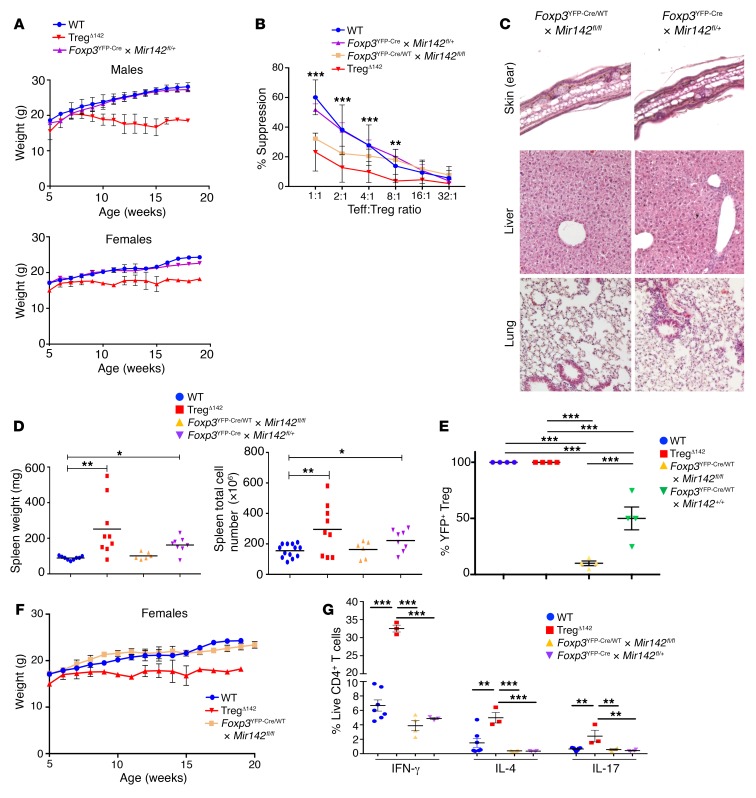
Figure 4. The cell-intrinsic Treg suppressive defect is directly attributable to cell-specific loss of miR-142 expression.
(A) Weight charts of WT, TregΔ142, and Foxp3YFP–Cre × Mir142fl/+ mice (male and female; n > 9). WT and TregΔ142 data are also shown in Figure 3A. (B) Coculture suppression assays (data combined from 3 independent experiments). P values represent comparison between WT, TregΔ142, Foxp3YFP–Cre/WT × Mir142fl/fl, and Foxp3YFP–Cre × Mir142fl/+. **P < 0.01; ***P < 0.001, 1-way ANOVA. n > 4 per group. No significant difference noted between WT and Foxp3YFP–Cre × Mir142fl/+. (C) H&E staining of formalin-fixed, paraffin-embedded sections from ear skin, liver, and lung from FoxP3YFP–Cre/WT × Mir142fl/fl and Foxp3YFP–Cre × Mir142fl/+ mice. Original magnification, ×10. (D) Comparison of spleen weights and cell counts. *P < 0.05; **P < 0.01, 1-way ANOVA. n > 6. (E) YFP+ Tregs as a percentage of the total Treg pool (CD4+CD25+FoxP3+) from WT, TregΔ142, Foxp3YFP–Cre/WT × Mir142fl/fl (female), and Foxp3YFP–Cre × Mir142fl/+ (male and female) mice. n = 4 per group. ***P < 0.001, 1-way ANOVA. (F) Weights of WT, TregΔ142, and Foxp3YFP–Cre/WT × Mir142fl/fl (female). n > 6 per group. One-way ANOVA. (G) Cytokine secretion profiles of CD3+CD4+ and CD3+CD8+ T cells from WT, TregΔ142, Foxp3YFP–Cre/WT × Mir142fl/fl (female), and Foxp3YFP–Cre × Mir142fl/+ mice (male and female). n ≥ 3. **P < 0.01; ***P < 0.001, 1-way ANOVA.

